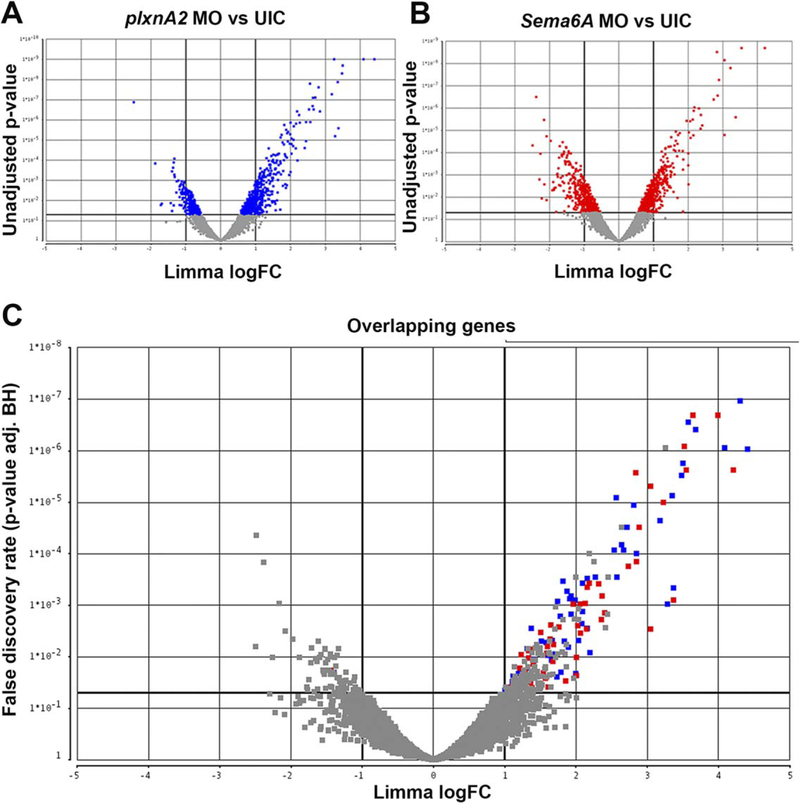
Fig. 2.
Volcano plots denoting differential gene expression. Each point represents a gene in the microarray. A: Gene expression changes between plxnA2 MO and uninjected controls (UIC). B: sema6A MO compared with UIC. Gray are nonsignificant. C: Overlapping genes in both plxnA2 and sema6A plots. Blue squares indicate significantly different expression levels in plxnA2 MO-UIC, red squares in sema6A MOUIC. Gray are nonsignificant in at least one condition, with under a two-fold change difference in expression or P > 0.05.

