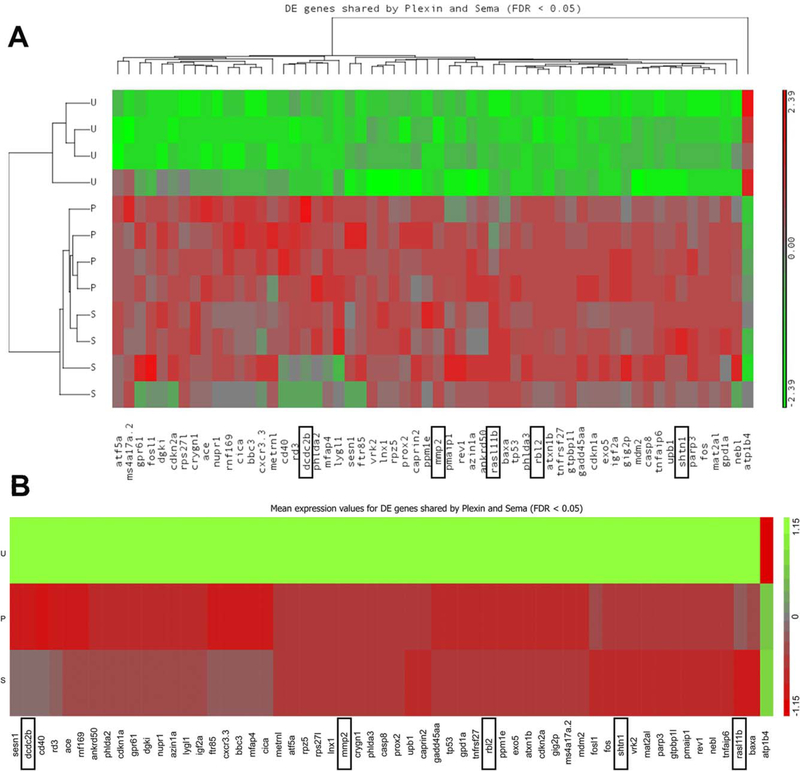
Fig. 3.
Microarray heat map of 58 differentially regulated genes in common to both sema6A MO-UIC and plxnA2 MO-UIC. Differential expression is represented on a green to red scale with expression values standardized to a mean of zero and standard deviation of one. A: Results from each of the four replicates are shown. B: Average expression change of four replicates. Boxes indicate validated genes. U, uninjected control; S, sema6A MO; P, plxnA2 MO.

