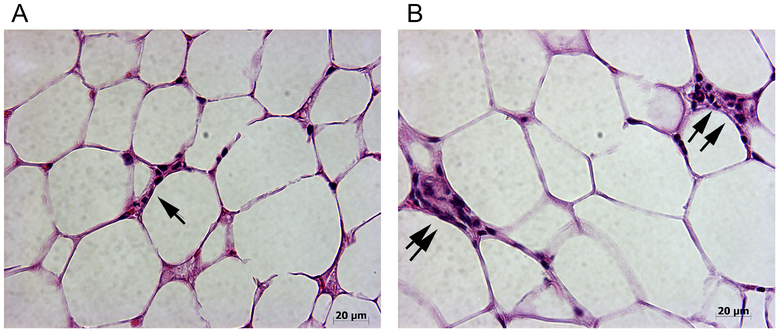
Fig. 3:
Dietary PUFA regulation of mammary adipose tissue inflammation
Crown-like-structures (CLS) were analysed in H & E stained sections of mammary fat pad from mice that received the differing PUFA composition diets for 20 weeks5. MFP from mice fed ω−3 diet (Fig. 3A) and ω−6 diet (Fig. 3B). Mice given the ω−3 diet had fewer and smaller CLS relative to mice given an ω−6 diet. Single arrow indicates small CLS and double arrows indicated large CLS. Note the difference in size of the adipocytes in the MFPs of mice on the different diets, i.e. the adipocytes are significantly larger in the mice given ω−6 diets. Images were taken at 400x magnification.

