
Figure 6. MitoGraph analysis of a variety of cell types.
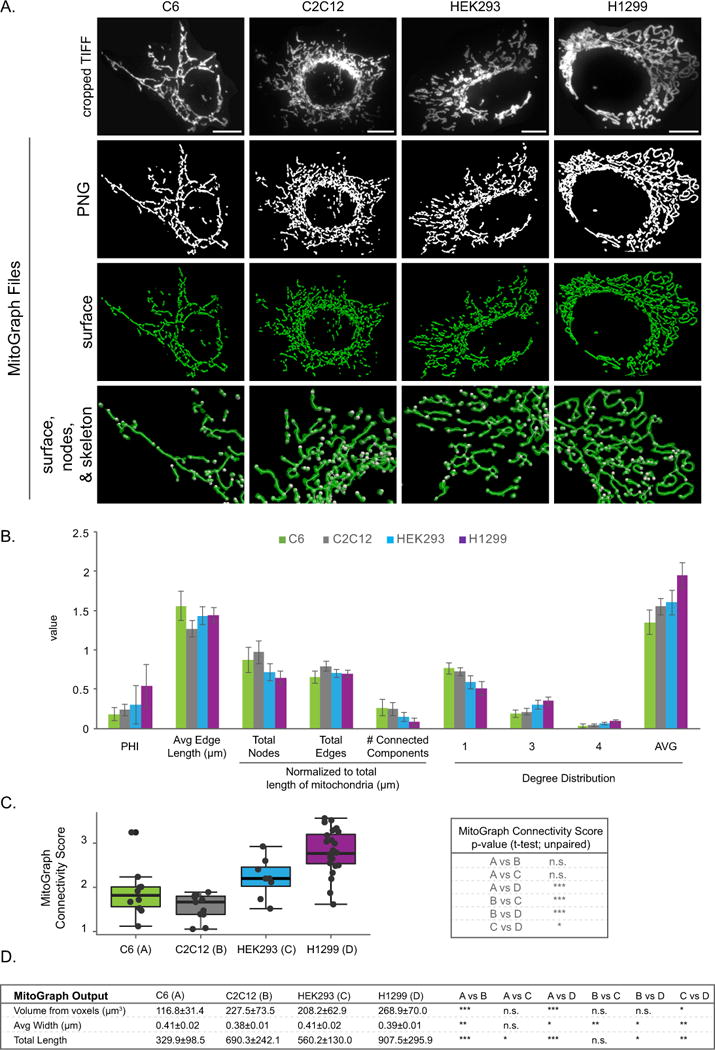
A-C) C6, C2C12, HEK293 and H1299 cells were fixed in 4% PFA, immunostained for Tom20, imaged using the 100x objective (zoom 1) and processed by MitoGraph v3.0 using the following command (identical to Figures 4–5): ./MitoGraph -xy 0.1600 -z 0.2 -scales 1.0 1.3 4 -adaptive 10 -path ~/Desktop/cells/. A) The top row represents the original cropped TIFF file, the bottom 3 rows are output files of MitoGraph (the binary PNG, the 3D surface representation and a zoom in on the surface, skeleton and nodes of the mitochondrial network. B) The .GNET files were processed using an R-script to compile the following metrics (see Supplemental Figures 3 and 4 for detailed descriptions of how these metrics were calculated): PHI (ratio of the largest connected component); average edge length; total nodes, edges and connected components (normalized to total length of mitochondria); the degree distribution of the nodes (1 (free ends), 3 (3-way junction), 4 (4-way junction) and Avg Degree). C) The MitoGraph connectivity score which is calculated from the sum of metrics elevated in a fused state (PHI, Avg Edge Length and Avg Degree) divided by sum of metrics which are elevated in a fragmented state (total nodes, edges and connected components (normalized)). D) The AVG±STDEV of the indicated parameters, p-value was calculated using an unpaired Students t-test. Scale bar represents 10μm.