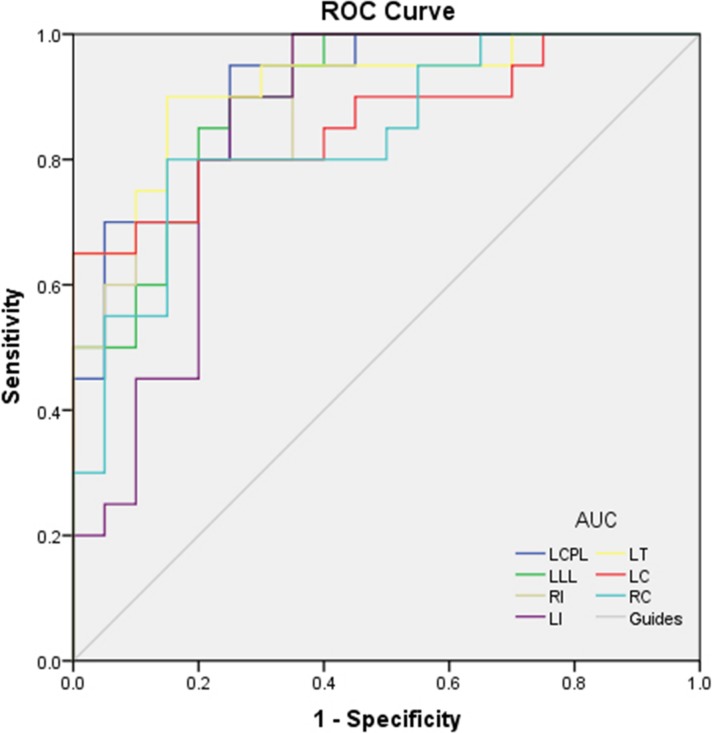
Figure 2.
ROC curve analysis of the GMV values for altered brain regions. The AUCs were 0.908 (P < 0.001; 95% CI: 0.819–0.996) for LCPL, LLL 0.895 (P < 0.001; 95% CI: 0.800–0.990), RI 0.895 (P < 0.001; 95% CI: 0.801–0.989), LI 0.848 (P < 0.001; 95% CI: 0.721–0.974), LT 0.918 (P < 0.001; 95% CI: 0.830–1.000), LC 0.860 (P < 0.001; 95% CI: 0.743–0.977), and RC 0.838 (P < 0.001; 95% CI: 0.713–0.962). LCPL, left cerebellum posterior lobe; LLL, left limbic lobe; RI, right insula; LI, left insula; LT, left thalamus; LC, left caudate; RC, right cuneus.

