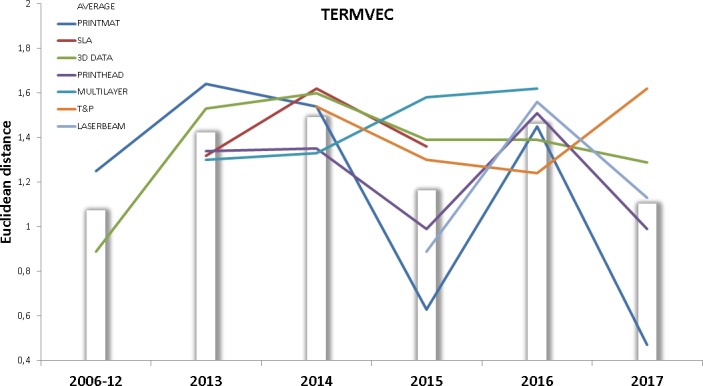
Fig 16. TERMVEC for each technology front.

This figure shows the evolution of the TERMVEC indicator for each technology front. Data points above the bars indicate higher than average Euclidean distance between term vectors.

This figure shows the evolution of the TERMVEC indicator for each technology front. Data points above the bars indicate higher than average Euclidean distance between term vectors.