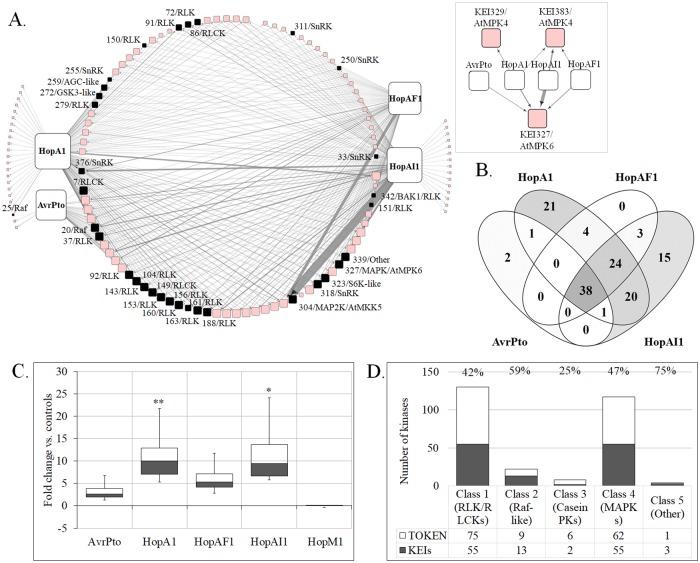
Fig 2. A plant–pathogen interaction screen identifies new candidate plant targets.
A. An in vivo interaction network of tomato kinases with Pseudomonas syringae effectors. We tested 210 Kinase–AvrPto pairs, 299 Kinase–HopA1, 305 Kinase–HopAI1, and 326 Kinase–HopAF1 using SLC in tomato cells. The node size represents degree (number of outgoing and incoming edges; larger size = higher degee), and edge thickness indicates the interaction strength (fold increase over control) on a continuous scale (thicker = stronger interaction). Known K-E interactions tested in the SLCAs are represented separately in the inset network. The inset network shows interactions of the tomato homologs of the known effector targets KEI327/SlMPK1 and KEI384/AtMPK4, with four effectors. Nodes in black represent the KEIs selected for functional characterization. The networks were visualized in Cytoscape 3.6.1. B. Venn diagram showing common and unique interacting kinases for HopA1, HopAF1, HopAI1, and AvrPto. C. Boxplots showing the distribution of interaction strength represented as fold change versus controls, for the five individual effectors tested. *p < 0.01 or **p < 0.05, t test. D. The distribution of KEIs across the five structural classes of plant kinases. The digits show the percentage of KEIs found to interact with pathogen effectors within each kinase class. BAK1, BRI1-ASSOCIATED KINASE1; K-E, kinase–effector; KEI, Kinase Effector Interactor; MAPK, MAP kinase; MAP2K, MAPK kinase kinase; PK, protein kinase; RLCK, receptor-like cytosolic kinase; RLK, receptor-like kinase; SLC, split-luciferase complementation; SLCA, split-luciferase complementation assay; SnRK, Snf1-related protein kinase; S6K, ribosomal protein S6 kinase; TOKN, Tomato Kinase cDNA library.

