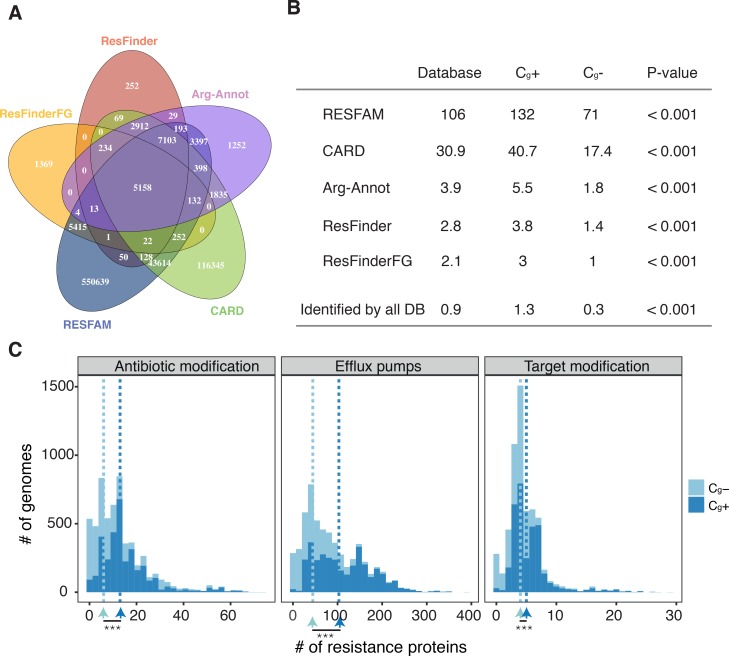
Fig 5. Antibiotic resistance proteins in genomes.
Results displayed correspond to those hits with at least 50% of protein identity for all databases (except RESFAM, which is based on HMM profiles). A. Venn Diagram showing the total number of genes associated with antibiotic resistance in all Cg+ according to five different ARG databases. B. Mean number of ARGs per genome, for all five databases and the intersect between them (Identified by all DB). P-value corresponds to the difference between the mean MGE in Cg+ and in Cg- genomes (all corrected for genome size). C. Distribution of resistance proteins per genome in function of capsule content classified by resistance mechanisms. These results are based on protein hits from the RESFAM database. Stars indicate significant difference in the median number of resistance proteins, *** P < 0.001.

