Figure 2A and B.


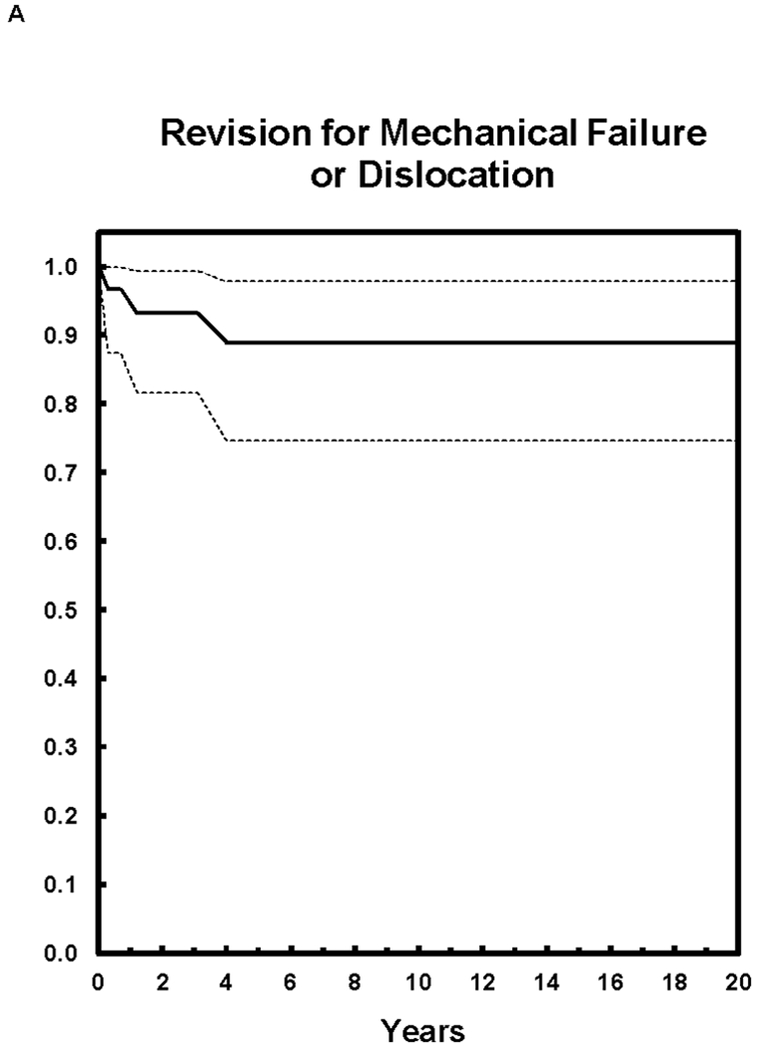
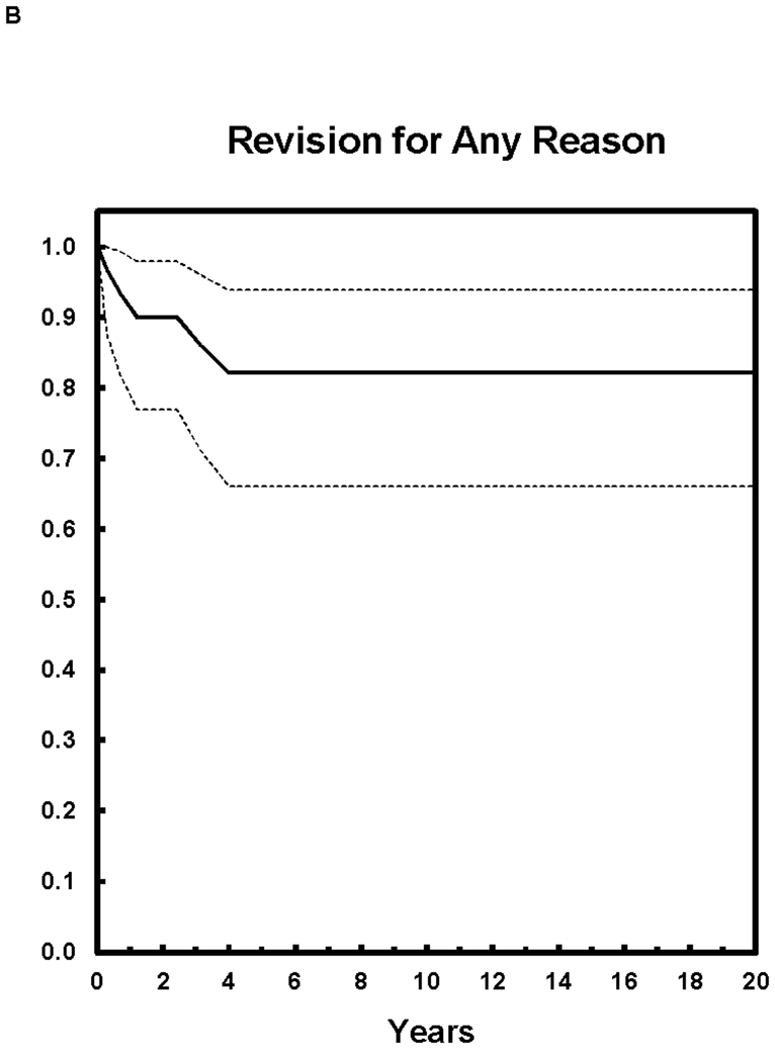
Kaplan-Meier survivorship curves with 95% confidence intervals with the end point of revision for mechanical failure and dislocation (A) and for the end point of revision for any reason (B).


Kaplan-Meier survivorship curves with 95% confidence intervals with the end point of revision for mechanical failure and dislocation (A) and for the end point of revision for any reason (B).