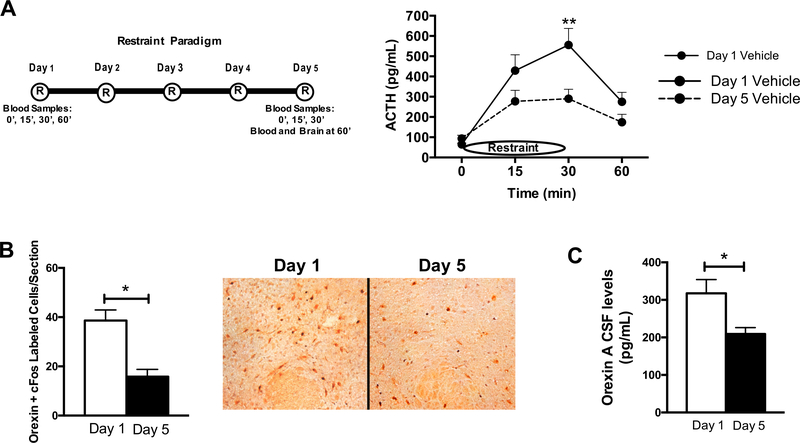
Fig. 1.
Orexin levels habituate with repeated restraint stress (n = 10/group). (A) Left: Depiction of Restraint Paradigm and Blood collection. Right: Plasma ACTH data for Day 1 and Day 5 of restraint. Vehicle/Vehicle-treated animals display habituation over the 5 days of restraint stress, with decreased plasma ACTH values on day 5 compared to day 1 (2-Way ANOVA, Day: F(1,67) = 8.2, p = 0.006; Time: F(1,67) = 12.7, p < 0.0001). (B) Total orexin neurons dual labeled with cFos on day 1 versus day 5 of restraint stress (T test, p < 0.05). Right, representative 10x magnification images of the lateral hypothalamus with cFos (black) and orexin (red) dual stain on Day 1 and 5 of restraint. (C) Orexin levels in the CSF on day 1 and 5 of restraint stress (T test, p < 0.05). *p < 0.05, **p < 0.01, ***p < 0.0001. (For interpretation of the references to color in this figure legend, the reader is referred to the web version of this article.)

