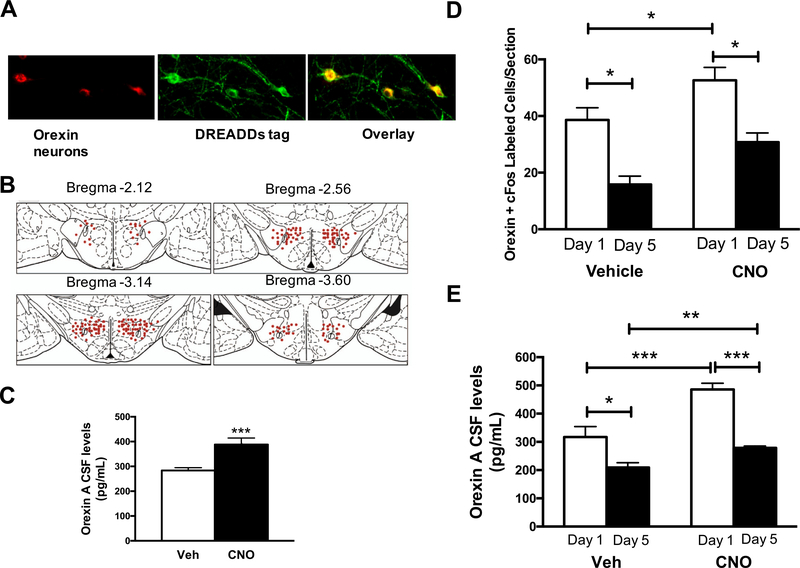
Fig. 2.
Stimulation of orexins prior to each of five daily 30-min restraints (n = 10/group). (A) Representative images of DREADDs expression in the lateral hypothalamus at 20x magnification. Orexin Neurons = red, DREADDs’ tag = green, orexin neurons transfected with virus = yellow. (B) Viral expression along four levels of Bregma (anterior to posterior) in a cartoon using rat brain atlas images. Each red dot represents 10 cells expressing the viral tag. (C) Orexin A levels in CSF following vehicle or CNO treatment (non-restraint stress conditions; T test, p < 0.001). (D) Total orexin neurons dual labeled with cFos in acute and repeated restraint stress following either vehicle or CNO pretreatment (2-Way ANOVA, Day: (F (1,62) = 9.6, p < 0.001; CNO: F(1,62) = 4.1, p < 0.05, Interaction: F(1,62) = 0.01, p = 0.95). (E) Orexin A levels in the CSF following acute and repeated restraint stress with either vehicle or CNO pretreatment (2-Way ANOVA, Day: (F(1,37) = 26.47, CNO: p < 0.0001; Interaction: F(1,37) = 15.05, p = 0.0004; F(1,37) = 2.6, p = 0.11). *p < 0.05, ***p < 0.001. (For interpretation of the references to color in this figure legend, the reader is referred to the web version of this article.)

