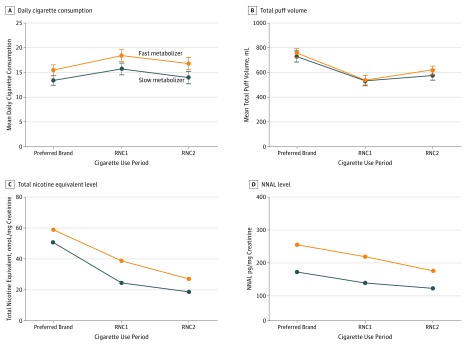
Figure 3. Differences in Primary Measures of Smoking Behavior and Urinary Biomarkers of Exposure Across Cigarette Use Periods by Nicotine-Metabolite Ratio Group.
Mean daily cigarette consumption (A) and mean total puff volume (B) depict arithmetic mean and SE. Total nicotine equivalent level (C) and 4-(methylnitrosamino)-1-(3-pyridyl)-1-butanol (NNAL) level (D) depict geometric mean only. RNC indicates reduced nicotine content of 5.2 mg (RNC1) and 1.3 mg (RNC2) of nicotine per gram of tobacco.

