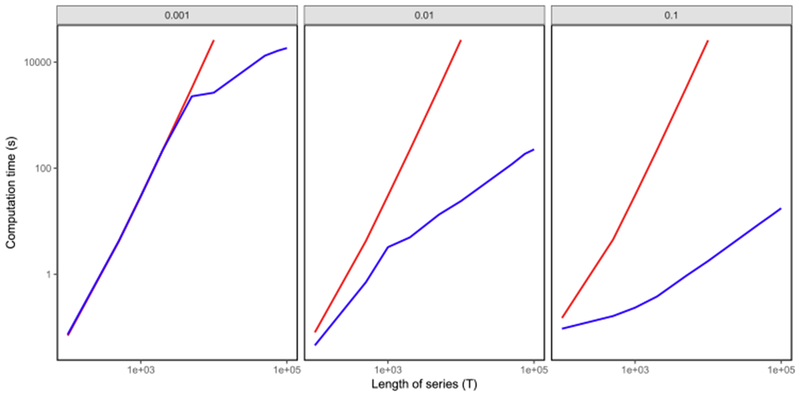
Fig. 2.

Timing results for solving (5) for the global optimum, using Algorithms 1 ( ) and 2 (
 ). The x-axis displays the length of the time series (T), and the y-axis displays the average running time in seconds. Each panel, from left to right, corresponds to data simulated according to (1) with st ~i.i.d. Poisson(θ), with θ ∈ {0.001, 0.01, 0.1}. Standard errors are on average < 0.1% of the mean compute time. Additional details are provided in
Section 2.4.
