
Fig. 4.
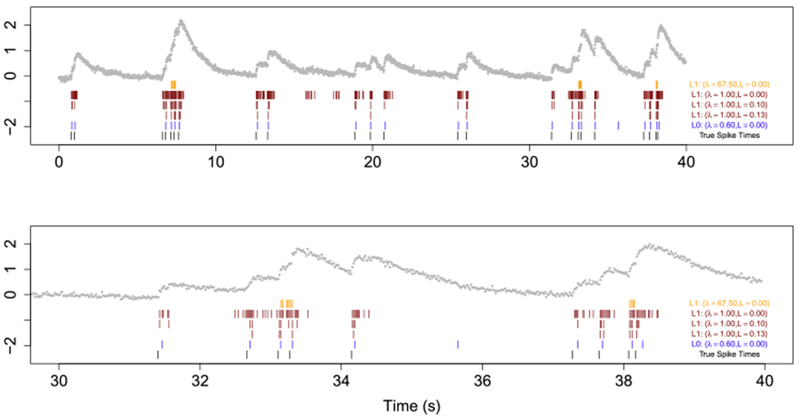
Spike detection for cell 2002 of the
Chen et al. (2013)
data. The observed fluorescence ( ) and true spikes (
 ) are displayed. Estimated spike times from the ℓ0
problem (4) are shown in (
) are displayed. Estimated spike times from the ℓ0
problem (4) are shown in ( ), estimated spike times from the ℓ1
problem (3) are shown in (
), estimated spike times from the ℓ1
problem (3) are shown in ( ), and estimated spike times from the post-thresholding estimator (9) are shown in (
 ). Times 0s–35s are shown in the top row; the second row zooms into time 30s–40s in order to illustrate the behavior around a large increase in calcium concentration.