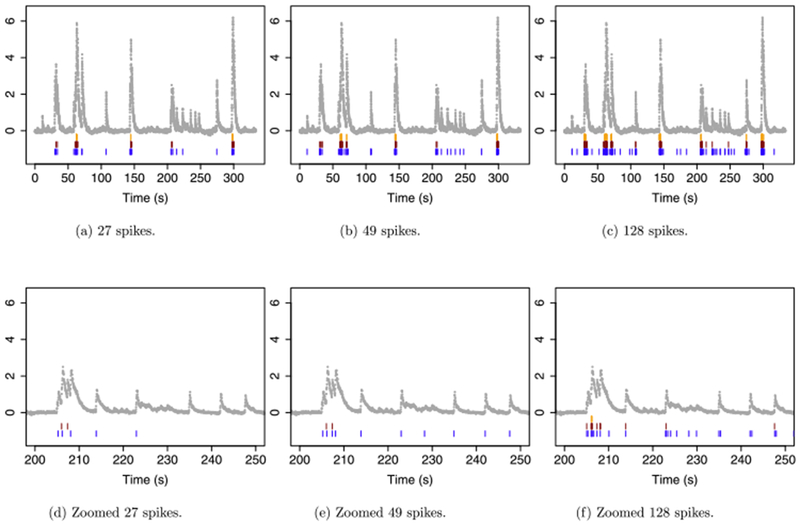
Fig. 5.

The first 10,000 timesteps from the second ROI in NWB 510221121 from the Allen Brain Observatory. Each panel displays the DF/F-transformed fluorescence ( ), the estimated spikes from the ℓ0
problem (
 ) (5), the estimated spikes from the ℓ1
problem (
 ) (3), and the estimated spikes from post-thresholding the ℓ1
problem (
 ) (9). The panels display results from applying the ℓ1
and ℓ0
methods with tuning parameter λ chosen to yield (a): 27 spikes for each method; (b): 49 spikes for each method; and (c): 128 spikes for each method. The post-thresholding estimator was obtained by applying the ℓ1
method with λ = 1, and thresholding the result to obtain 27, 49 or 128 spikes. (d)–(f): As in (a)–(c), but zoomed in on 200–250 seconds.
