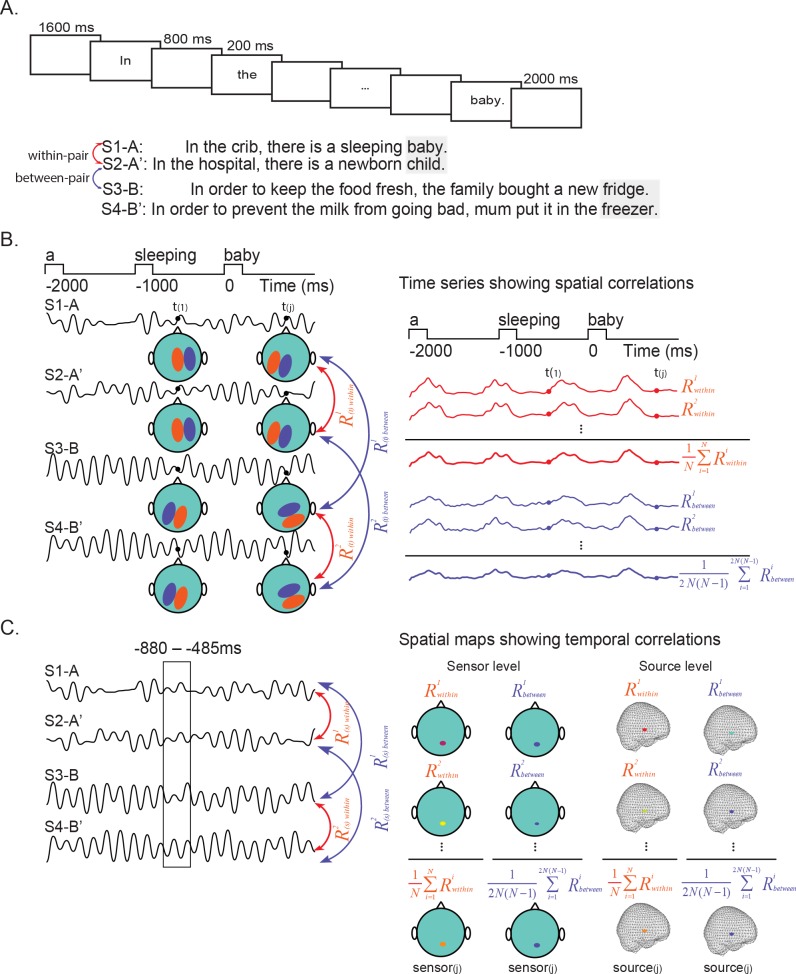
Figure 1. The experimental procedure and approach for Representational Similarity Analyses.
(A) Trials began with a blank screen (1600 ms). Sentences were presented in Chinese (translated here into English), word-by-word (200 ms per word; 800 ms blank interval between words). Sentences were followed either by ‘NEXT’ (2000 ms) or by a probe question (1/6th of trials, randomly). We constructed sentences in pairs such that the same word could be predicted from the context (e.g. S1-A and S2-A’; S3-B and S4-B') (although during presentation, members of each pair were presented separately, with at least 30 other sentences in between). One member of each pair ended with the predicted word (e.g. S1–A, S3–B) and the other member ended with a plausible but unpredicted word (e.g. S2–A’, S4–B’). Before the onset of the predicted word, we compared brain activity associated with the prediction of the same word (within-pairs) and a different word (between-pairs). (B) Spatial representational similarity analysis. Left: The pattern of MEG data over sensors was correlated between each sentence pair (e.g. S1–A and S2–A’) at each time sample t(j).. Right: The average spatial correlation values of pairs (R1within, R2within, …) in which the same word was predicted formed the within-pair spatial correlation time series (, shown in red). The average spatial correlation values of pairs (R1between, R2between, …) in which different words were predicted formed the between-pair spatial correlation time series (, shown in blue). (C) Temporal representational similarity analysis. Left: The temporal pattern of MEG activity was correlated between sentence pairs, at each sensor (sensor space) or at each grid point (source space). Right: The average temporal correlation values of pairs (R1within, R2within, …) in which the same word was predicted formed the within-pair temporal correlation topographic/source maps. The average temporal correlation values of pairs (R1between, R2between, …) in which different words were predicted formed the between-pair temporal correlation topographic/source maps.

