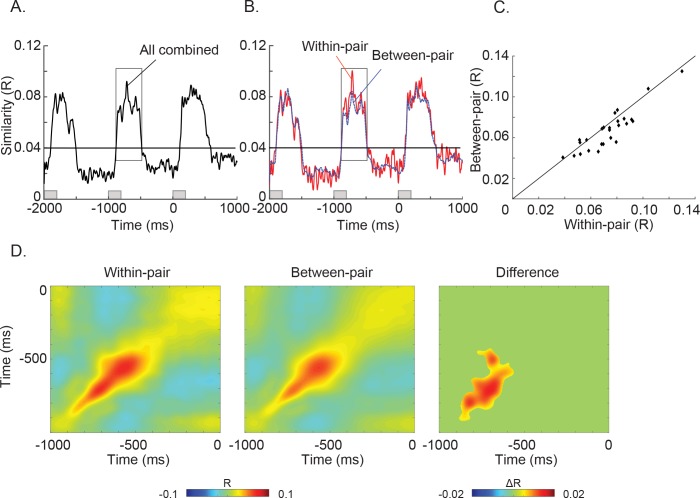
Figure 2. Results of the Spatial Representational Similarity Analysis.
(A) The time series of spatial similarity R values combined across the within-pair and between-pair correlations. The horizontal line indicates a threshold of R = 0.04 where the general increase in spatial correlation was largest. (B) The time series of spatial similarity R values for pairs in which the same word was predicted (within-pairs, shown in red) and in which a different word was predicted (between-pairs, shown in blue). Both the within- and the between-pair spatial similarity time series showed a sharp increase at ~100 ms and a decrease at ~500 ms after the onset of each word. Between −880 and −485 ms before the onset of the final word, the spatial similarity was greater when the same word was predicted than when different words were predicted (within-pairs >between-pairs: t(25) = 3.751, p < 0.001). (C) Scatter plots of spatial similarity values averaged between −880 and −485 ms before the onset of the final word in 26 participants. In most participants (18/26) the within-pair spatial correlations were greater than the between-pair spatial correlations. (D) Cross-temporal spatial similarity matrices for the within- and between-pair correlations (Red: positive correlations; blue: negative correlations). Left and middle: Both sets of pairs showed increased spatial similarity along the diagonal with greater similarities for the within- than the between-pairs in the −900 – −500 ms interval prior to the onset of the final word. Right: The matrix shows the cluster with a statistically significant difference between the within-pair and between-pair spatial correlations (p = 0.002, cluster-randomization approach controlling for multiple comparisons over time). The absence of ‘off-diagonal’ correlations suggests that the spatial pattern of neural activity associated with the predicted word was reliable but changed over time.
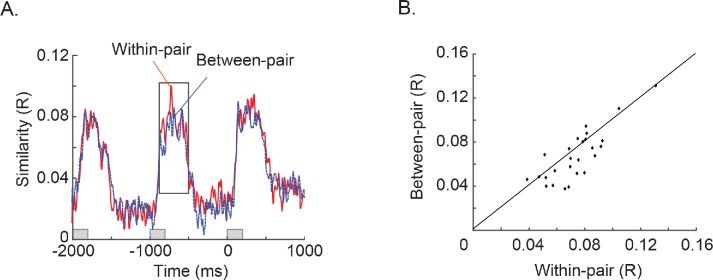
Figure 2—figure supplement 1. Results of the Spatial Representational Similarity Analysis after matching the number of pairs between the within-pair and between-pair correlations.
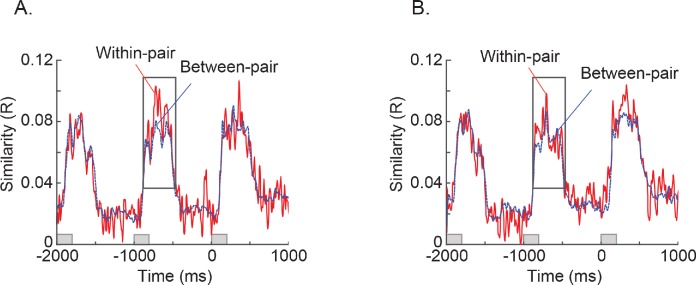
Figure 2—figure supplement 2. Results of the Spatial Representational Similarity Analysis in a subset of sentence pairs that had the same pre-sentence-final word (SFW-1) but predicted a different SFW (a subset of between-pairs, shown in blue), and a subset of sentences that constrained for these same SFWs, but which differed in the SFW-1 (a subset of within-pairs, shown in red).
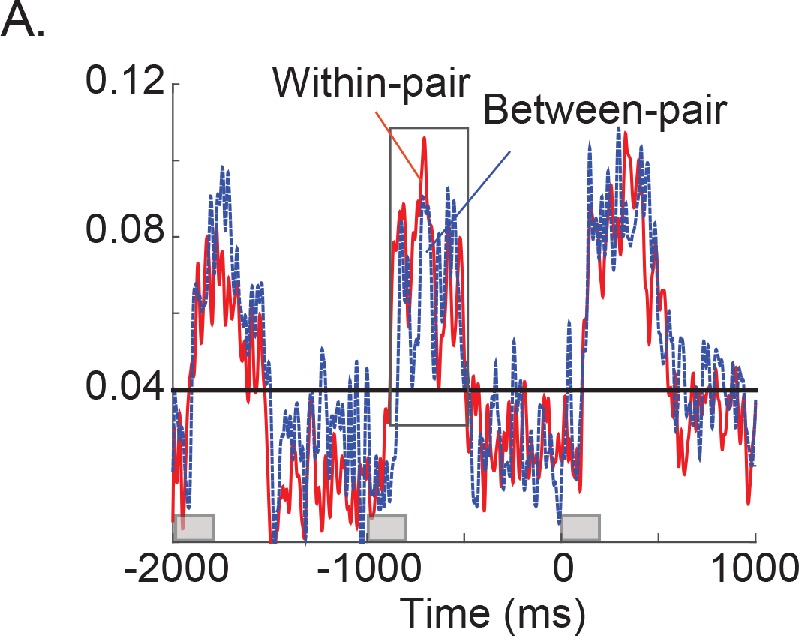
Figure 2—figure supplement 3. Results of the Spatial Representational Similarity Analysis for two subsets of trials where (A) sentences ending with expected words were seen first or (B) sentences ending with unexpected words were seen first.
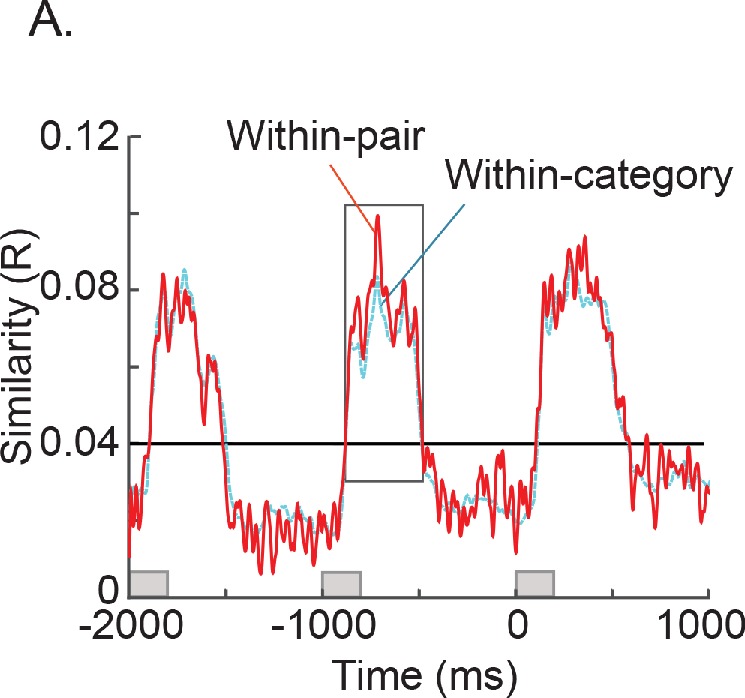
Figure 2—figure supplement 4. Results of the Spatial Representational Similarity Analysis for pairs in which the same word was predicted (within-pair, shown in red) and in which the same syntactic category (e.g. nouns or verbs) of words (but not the same words) was predicted (within-category, shown in cyan).
