. 2018 Dec 21;7:e39061. doi: 10.7554/eLife.39061

Figure 3. Results of the Temporal Representational Similarity Analysis.

The Temporal Representational Similarity Analysis was carried out between −880 and −485 ms before the onset of the final word. (A) Temporal similarity topographic maps at the sensor level. Left and middle: Both the within- and between-pair correlations revealed increased temporal similarity over bilateral temporal and posterior sensors. Right: the difference map revealed greater temporal similarity when the same word was predicted (within-pairs) than when a different word was predicted (between-pairs) over central and posterior sensors. The sensors where this difference was significant at the cluster level are marked with black asterisks (p = 0.002; a cluster-randomization approach controlling for multiple comparisons over sensors). (B) Temporal similarity difference map in source space. The correlation values were interpolated on the MNI template brain and are shown both on the coronal plane (Talairach coordinate of peak: y = −19.5 mm) and the sagittal plane (Talairach coordinate of peak: x = −39.5 mm). This revealed significantly greater temporal similarity between sentence pairs that predicted the same word (within-pairs) than pairs that predicted a different word (between-pairs) within the left inferior temporal gyrus, extending into the medial temporal lobe including the left fusiform, hippocampus and parahippocampus as well as left cerebellum (p = 0.006; a cluster-randomization approach controlling for multiple comparisons over grid points).
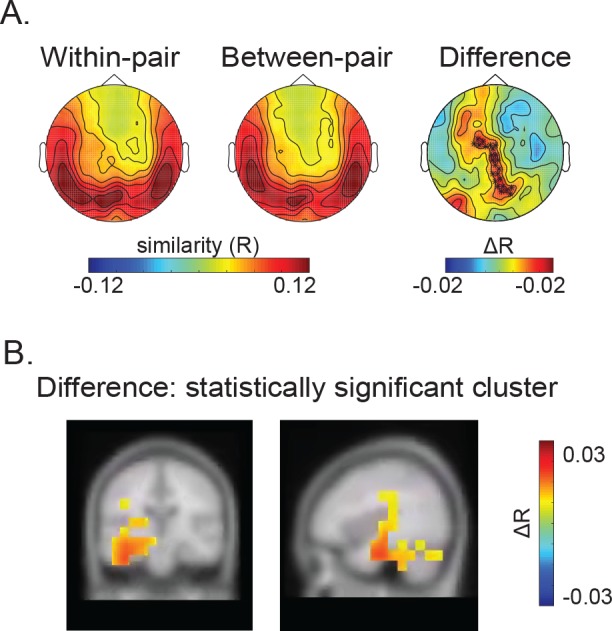
Figure 3—source data 1. Data used for plotting Figure 3 as well as its supplementary Figures.
DOI: 10.7554/eLife.39061.013

Figure 3.

Figure 3—figure supplement 1. Results of the Temporal Representational Similarity Analysis after matching the number of pairs between the within-pair and between-pair correlations.
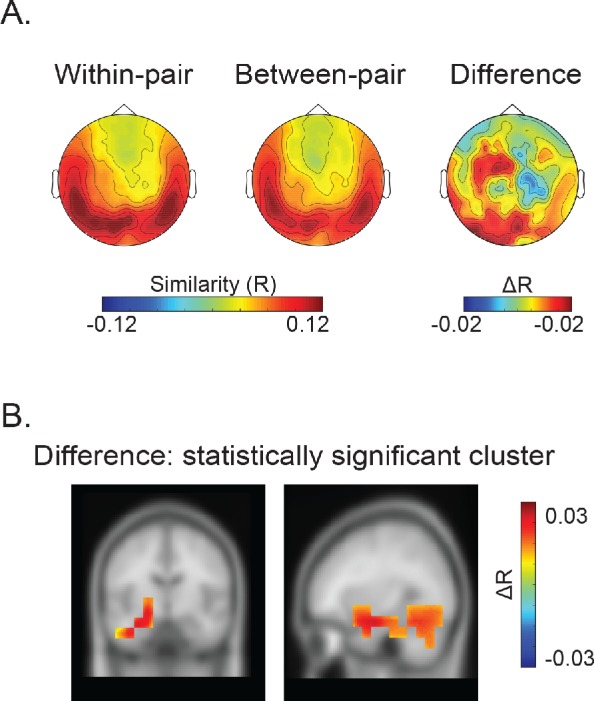
Figure 3—figure supplement 1.

The Temporal Representational Similarity Analysis was carried out between −880 and −485 ms before the onset of the final word. (A) Temporal similarity topographic maps at the sensor level. Left and middle: Both the within- and between-pair correlations revealed increased temporal similarity over bilateral temporal and posterior sensors. Right: the difference map revealed greater temporal similarity when the same word was predicted than when different words were predicted over central and posterior sensors (marginally significant cluster: p = 0.0679; a cluster-randomization approach controlling for multiple comparisons over sensors). (B) Temporal similarity difference map in source space. The values were interpolated on the MNI template brain and are shown both on the coronal plane (Talairach coordinate of peak: y = −9.5 mm) and the sagittal plane (Talairach coordinate of peak: x = −29.5 mm). This revealed significantly greater temporal similarity between sentence pairs that predicted the same word than pairs that predicted a different word within the left inferior temporal region and extended into the left hippocampus, left fusiform, parahippocampus as well as left cerebellum (p = 0.034; a cluster-randomization approach controlling for multiple comparisons over grid points).
Figure 3—figure supplement 2. Results of the Temporal Representational Similarity Analysis showing the 85% maximum difference of the statistically significant cluster in source space.
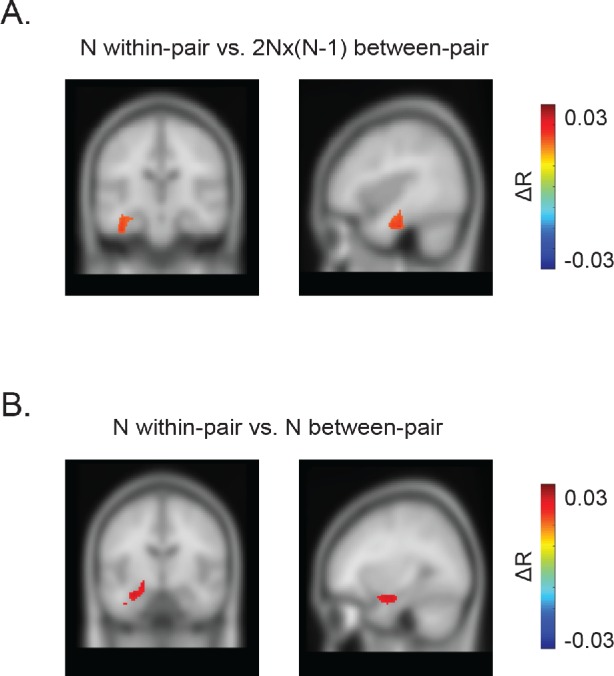
Figure 3—figure supplement 2.

The Temporal Representational Similarity Analysis was carried out between −880 and −485 ms before the onset of the final word. (A) Temporal similarity difference map in source space between the averaged N within-pair correlations and 2N(N-1) between-pair correlations. The values were interpolated on the MNI template brain and are shown both on the coronal plane (Talairach coordinate of peak: y = −19.5 mm) and the sagittal plane (Talairach coordinate of peak: x = −39.5 mm). The maximum difference between the within-pair and the between-pair correlations was found within the left inferior temporal gyrus, and the cluster extended into the medial temporal lobe including the left fusiform, hippocampus and parahippocampus. (B) Temporal similarity difference map in source space between the averaged N within-pair correlations and N between-pair correlations. The values were interpolated on the MNI template brain and are shown both on the coronal plane (Talairach coordinate of peak: y = −9.5 mm) and the sagittal plane (Talairach coordinate of peak: x = −29.5 mm). The maximum difference between the within-pair and the between-pair correlations was found within the left inferior temporal gyrus, and the cluster extended into the medial temporal lobe including the left fusiform, hippocampus and parahippocampus.