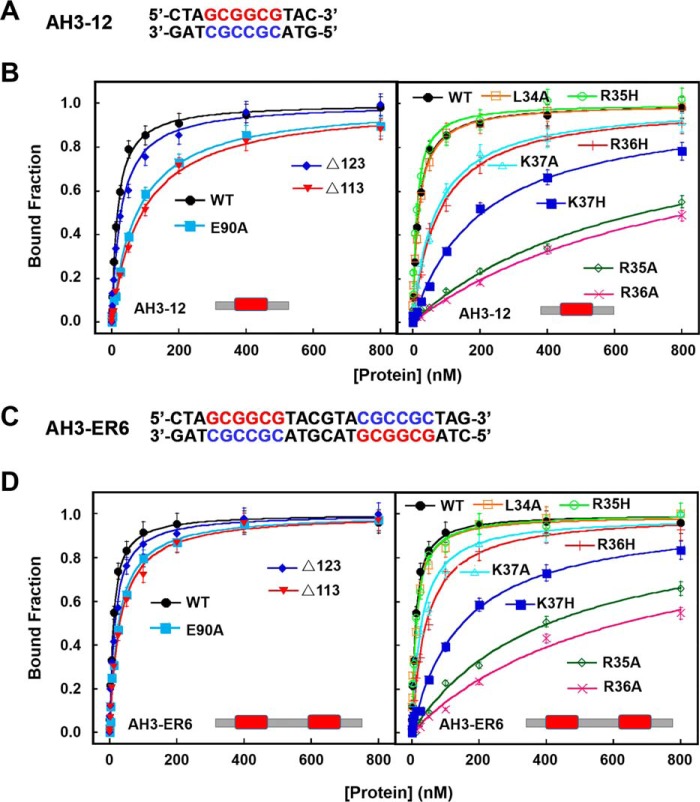
Figure 3.
DNA-binding activities of WT and mutated TtRa2LD determined with FABA. A, fluorescent-labeled DNA sequence of AH3–12. B, FABAs were performed with 2.5 nm AH3–12 and increasing concentrations of WT and mutant proteins as indicated. The determined dissociation constants are summarized in Table 2. C, fluorescent-labeled DNA sequence of AH3–ER6. D, same assays as in B, but AH3–ER6 was used. The determined dissociation constants are summarized in Table 2.

