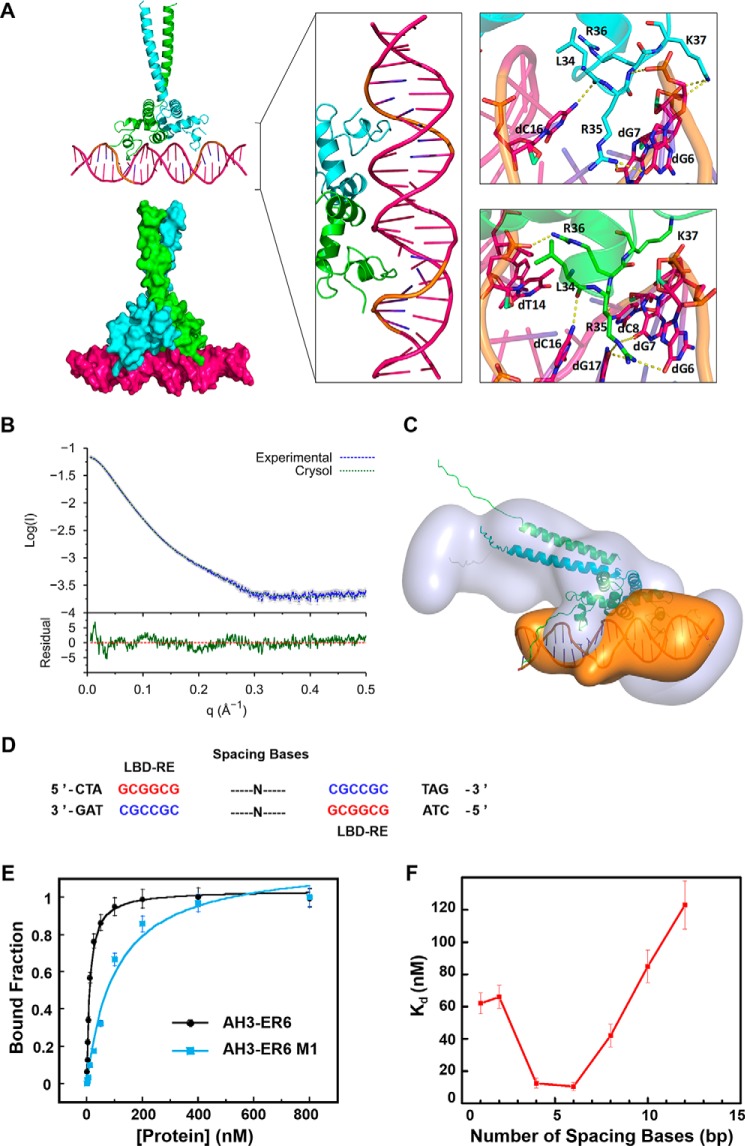
Figure 6.
Molecular model of the TtRa2LD–AH3–ER6 complex. A, modeled TtRa2LD–DNA complex structure. In the left panel, the modeled complex structures are shown in cartoon and surface, respectively. The middle panel is a detailed view of the protein–DNA complex in which two zinc fingers contact with the major groove of the DNA. The right panel shows a closer view of the hydrogen-bond contacts between the highly conserved amino acids and the LBD motif (5′-GCGGCG-3′). Two TtRa2LD monomers were colored in green and cyan, respectively. DNA is colored in hot pink, and the LBD motif is colored in orange. B, SAXS profile of TtRa2LD–AH3–ER6 complex. Error bars are shown in gray. The fit and the residual of the atomic model calculated by CRYSOL is shown with its residual (Iexp − Imodel/σexp (χ2 = 4.24), together with the residual defined as (Iexp(q) − Icalc(q))/Sexp(q), corresponding to the difference between the experimental and the computed intensities weighed by experimental errors (standard deviations). C, ab initio model of TtRa2LD–AH3–ER6 complex. D, DNA sequences of AH3–ERN spaced by different spacing lengths (n = 1–12 bp). E, FABA analysis of TtRa2LD with fluorescently labeled AH3–ER6 sequence, and its derivative AH3–ER6 M1 in which one LBD–ER motif CGCCGC is replaced by AATTTAT. F, relationship between the DNA-binding affinity and the number of spacing bases. A series of fluorescently labeled AH3–ER6 derivatives in which the two LBD–ER motifs CGCCGC are spaced by different numbers of base pairs as indicated in Table S5. The dissociation constants (Kd) were determined by the FABA.

