
Figure 6.
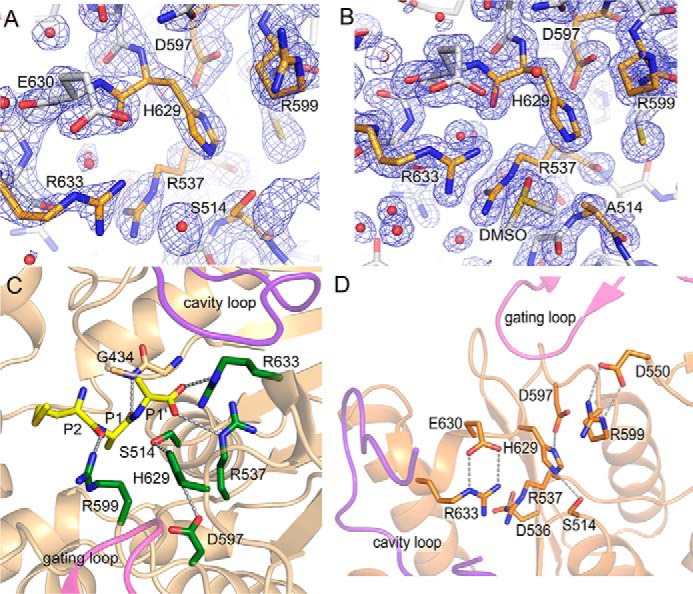
Structure of S9Cdr active sites. A and B, the electron density maps (2mFo − DFc at contour level 1.5σ) near the catalytic triad of the active state of S9Cdr WT (A) and S514A mutant (B). The relevant residues in both cases are shown in orange color. C, the substrate (Met-Ala-Ala; yellow sticks) was modeled in the active site of the active state of S9Cdr S514A mutant using Polder map. This structure was aligned with the active state of WT S9Cdr to make the figure. Substrate-binding arginine residues and catalytic triad residues are colored in green sticks. D, stabilization of side chain conformations of substrate-binding arginine residues by respective aspartate/glutamate residues in the active S9Cdr.