Figure 1.
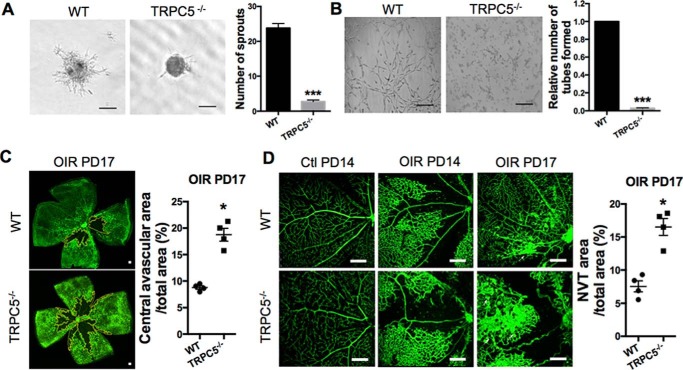
TRPC5 is involved in hypoxia-induced EC sprouting and mouse retinal angiogenesis. A, under 1% O2 hypoxia, primary MMECs from WT or TRPC5−/− mice were allowed to form spheroids for 24 h, followed by collagen embedding for another 24 h to form sprouts. Left panel, representative images showing the sprouting spheroids of MMECs from WT and TRPC5−/− mice under hypoxia. Right panel, morphometric analysis of sprout numbers per spheroid. n = 8 independent experiments. ***, p < 0.001 versus WT, unpaired t test with Welch's correction. B, left panel, representative images of tube formation of WT and TRPC5−/− MMECs that were seeded on Matrigel under hypoxic conditions for 10 to 14 h. Right panel, tube formation was quantitated as the number of tube-like structures in five randomly selected microscopic fields. n = 6 independent experiments. ***, p < 0.001 versus WT, Wilcoxon signed-rank test. C, pathological neovascularization upon OIR in WT and TRPC5−/− mice. Neonatal mice exposed to 75% O2 hyperoxia from PD7 to PD12 and 21% O2 normoxia from PD12 to PD17. Left panel, representative images of the isolectin B4-Alexa 488-positive (green) blood vessels of retinas with vaso-obliteration regions (outlined in yellow) at PD17. Right panel, quantification of the central avascular areas of retinas from WT and TRPC5−/− mice at PD17 in the OIR model. n = 4 independent experiments. *, p < 0.05 versus WT, unpaired Mann–Whitney test. D, representative images showing the retinal vasculature of control (PD14) and OIR (PD14 and PD17) mice. Vaso-obliteration was found in PD14 OIR retinas but not in control PD14 retinas. The white arrows indicate NVTs in PD17 OIR retinas. A statistical analysis of the NVT area in PD17 OIR retinas is shown on the right. n = 4 independent experiments. *, p < 0.05 versus WT, unpaired Mann–Whitney test. A–D, the values are means ± S.E. Scale bars = 100 μm (A and B), 500 μm (C), and 250 μm (D).

