Figure 2.
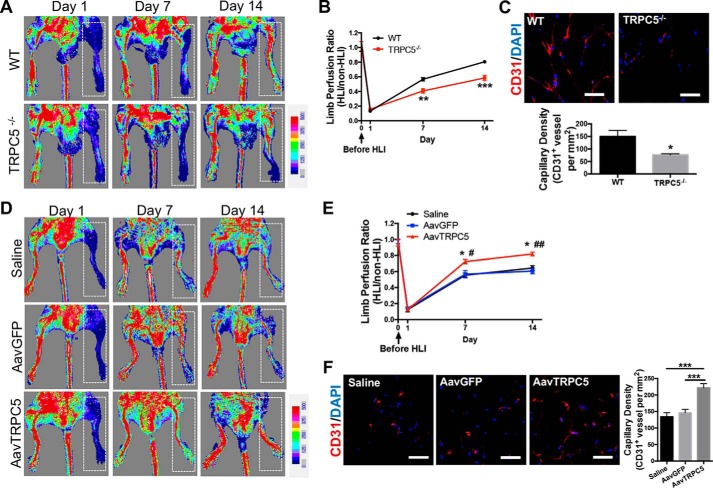
TRPC5 contributes to recovery from hind limb ischemia injury by promoting angiogenesis. A, HLI was surgically induced in WT and TRPC5−/− mice. Blood flow was determined by laser Doppler imaging on days 1, 7, and 14 after HLI. Ischemic limbs are highlighted by white dashed boxes. B, comparison of limb perfusion ratios between WT and TRPC5−/− mice measured on days 1, 7, and 14 after HLI. The final blood flow values are expressed as the ratios of ischemic to nonischemic hind limb perfusion. n = 7 to 8. Day 7: **, p < 0.01 versus WT; Student's unpaired two-tailed t test. Day 14: ***, p < 0.001 versus WT; unpaired Mann–Whitney test. C, immunofluorescent staining for CD31 (left) and quantitation of blood vessel densities (right) in adductor muscle sections from the injured limbs of WT and TRPC5−/− mice on day 14 after HLI. For the capillary and arteriole density assessments, the numbers of capillaries and arterioles were counted in five high-powered fields in each of the four tissue sections (per mouse) and then expressed as CD31+ vessels per square millimeter. n = 7 to 8. *, p < 0.05 versus WT, unpaired t test with Welch's correction. Scale bars = 50 μm. D, C57BL/6J mice were injected with an adeno-associated virus coding for TRPC5 (AavTRPC5) or GFP (AavGFP) or with saline 7 days before HLI surgery. Ischemic limbs are highlighted by white dashed boxes. E, limb perfusion ratios of the saline, AavGFP, and AavTRPC5 groups on days 1, 7, and 14 after HLI. The final blood flow values are presented as the ratios of ischemic to nonischemic hind limb perfusion. n = 6 to 7. Day 7: *, p < 0.05 versus saline; #, p < 0.05 versus AavGFP. Day 14: *, p < 0.05 versus saline; ##, p < 0.01 versus AavGFP. Dunn's multiple comparisons test. F, immunofluorescent staining for CD31 (left panel) and quantitation of blood vessel densities (right panel) in adductor muscle sections from the injured limbs of saline-, AavGFP-, and AavTRPC5-treated mice on day 14 after HLI. n = 6 to 7. ***, p < 0.001; one-way ANOVA and Dunnett's multiple comparisons test. Scale bars = 50 μm. A–F, representative laser Doppler images and micrographs. The values are means ± S.E.

