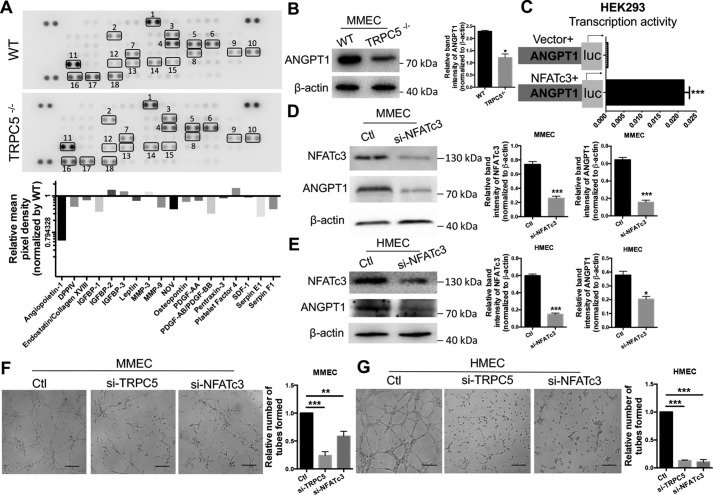
Figure 3.
Analysis of interplay between TRPC5, NFATc3, and ANGPT1 in ECs. A, top panel, detection of differentially regulated angiogenic proteins with an angiogenesis antibody array in WT and TRPC5−/− mouse serum samples. Duplicate spots: 1, Angiopoietin-1; 2, DPPIV; 3, Endostatin/Collagen XVIII; 4, IGFBP-1; 5, IGFBP-2; 6, IGFBP-3; 7, Leptin; 8, MMP-3; 9, MMP-9; 10, NOV; 11, Osteopontin; 12, PDGF-AA; 13, PDGF-AB/PDGF-BB; 14, Pentraxin-3; 15, Platelet Factor 4; 16, SDF-1; 17, Serpin E1; 18, Serpin F1. Bottom panel, quantitation of relative protein expression by comparing the mean pixel density of each factor in the TRPC5−/− group with that of each factor in the WT group. B, top, Western blotting of angiopoietin-1 (ANGPT1) in WT and TRPC5−/− primary MMECs with β-actin as a loading control. The image is representative of three independent experiments. Bottom, quantitation of ANGPT1 band intensity relative to β-actin. Values represent means ± S.E. of band intensities from three independent experiments. *, p < 0.05 versus WT, unpaired Mann–Whitney test. C, NFATc3 stimulates the transcriptional activity of ANGPT1 in HEK293 cells co-transfected with NFATc3 and a luciferase reporter plasmid carrying the 5′ flanking the 2012-bp sequence of ANGPT1. An empty vector was transfected as a control. The horizontal axis indicates relative luciferase activity. n = 5. ***, p < 0.001 versus vector, unpaired t test with Welch's correction. D and E, Western blots (left panels) and quantitation (right panels) of NFATc3 (n = 6) and ANGPT1 (n = 3) expression in primary MMECs (D) and HMECs (E) transfected with NFATc3 siRNA or scrambled siRNA. The band intensities were normalized to β-actin and quantified using ImageJ. ***, p < 0.001 versus control (Ctl), Student's unpaired two-tailed t test. *, p < 0.05 versus Ctl, unpaired Mann–Whitney test. F and G, representative images of the tube formation in primary MMECs (F) and HMECs (G) treated with TRPC5 siRNA, NFATc3 siRNA, or control scrambled siRNA. The data are means ± S.E. n = 5 to 8. F, **, p < 0.01; ***, p < 0.001 versus Ctl; Kruskal–Wallis test and Dunn's multiple comparisons test. G, ***, p < 0.001 versus Ctl, one-way ANOVA and Dunnett's multiple comparisons test. Scale bars = 50 μm. A–E, representative images are shown, and the values are means ± S.E.

