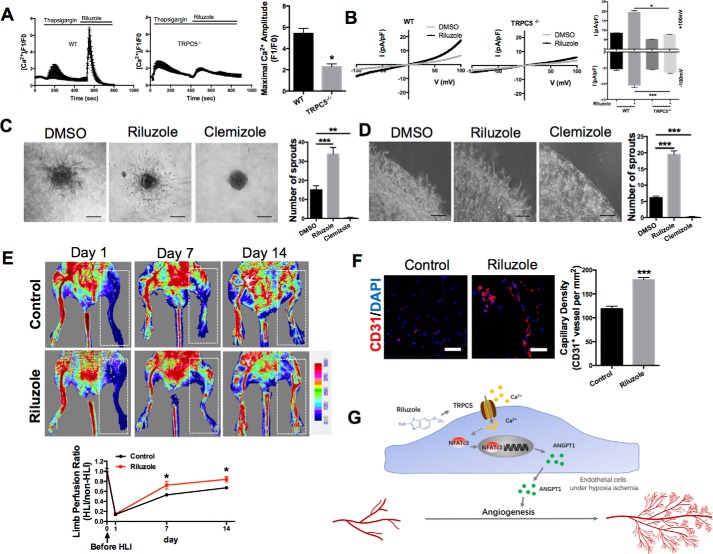
Figure 4.
TRPC5 activation by riluzole promotes ischemic tissue recovery. A, representative measurement of [Ca2+]i in Fluo-4-loaded MMECs from WT and TRPC5−/− mice. Internal Ca2+ stores were depleted with thapsigargin (2 μmol/liter) before riluzole (50 μmol/liter) was applied. The statistical analysis is shown on the right. The values are means ± S.E. of n = 4 independent experiments. *, p < 0.05 versus WT; unpaired Mann–Whitney test. For each experiment, 15–30 randomly chosen cells were analyzed. The maximum [Ca2+]i response of each cell after riluzole treatment was detected. B, representative whole-cell recordings from WT and TRPC5−/− MMECs with the current–voltage curves for basal and riluzole-induced (50 μmol/liter) currents. The values are means ± S.E. of n = 5 independent experiments. *, p < 0.05; Kruskal–Wallis test and Dunn's multiple comparisons test. ***, p < 0.001, one-way ANOVA and Tukey's multiple comparisons test. C and D, left panels, representative images of sprouting spheroids (C, n = 5) or angiogenic sprouting assays (D, n = 6) in WT MMECs. For the angiogenic sprouting assay, duplex cultured cells in matrix membrane with riluzole (50 μmol/liter), clemizole (10 μmol/liter), or DMSO were incubated for 24 h. Right panels, morphometric analysis. **, p < 0.01; ***, p < 0.001; one-way ANOVA and Dunnett's multiple comparisons test. E, HLI was surgically induced. The restoration rates of hind limb blood flow after treatment with or without riluzole (10 mg/kg/day) were compared by laser Doppler imaging on day 7 and day 14 after ischemia. Ischemic limbs are highlighted by white dashed boxes. n = 6. *, p < 0.05 versus control on day 7; unpaired t test with Welch's correction. *, p < 0.05 versus control on day14, Student's unpaired two-tailed t test. F, immunofluorescence of CD31 (left panel) and summary data (right panel) in adductor muscle sections from the injured limbs on day 14 after HLI. n = 6. ***, p < 0.001 versus control; Student's unpaired two-tailed t test. G, schematic of the TRPC5–NFATc3–ANGPT1 signaling pathway in angiogenesis under ischemia. A–F, representative images are shown, means ± S.E. Scale bars = 100 μm (C and D) and 50 μm (F).

