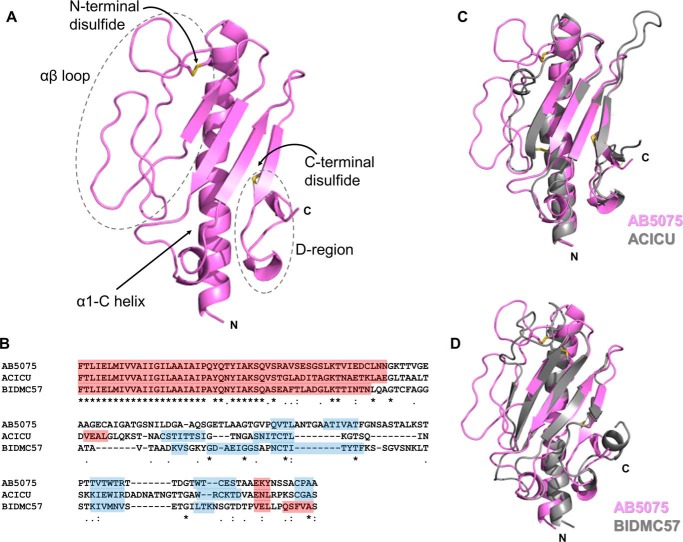
Figure 2.
Structure of PilAAB5075. A, cartoon representation of PilAAB5075 headgroup; disulfide bonds are displayed in yellow. B, sequence alignment of PilAAB5075, PilAACICU and PilABIDMC57. α-Helices are highlighted in red, and β-strands are in blue. Sequence identity (*), close similarity (:), and similarity (.) are indicated below. C, superimposition of PilAAB5075 (pink) and PilAACICU (gray). D, superimposition of PilAAB5075 (pink) and PilABIDMC57 (gray).

