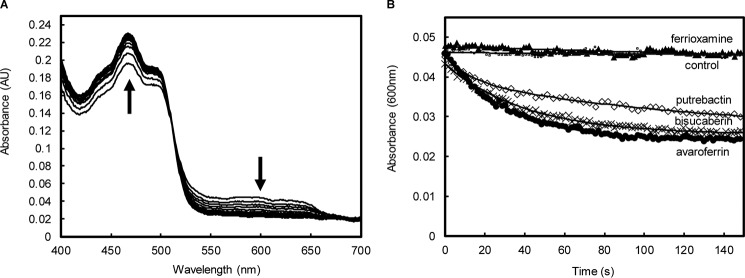
Figure 2.
SfSIP-mediated reduction of ferric-siderophores. A, absorption spectra changes during 150 s after mixing SfSIPsemi with ferric-siderophore avaroferrin. The up arrow indicates the increase in absorbance at 470 nm and the down arrow indicates a decrease in the absorbance at 600 nm. B, time-resolved traces of SfSIP-mediated reduction of ferric-siderophores (600 nm): ▴, ferrioxamine E; ●, avaroferrin; ♢, putrebactin; ×, bisucaberin; □, control (apo-avaroferrin) and the respective fittings (solid lines).

