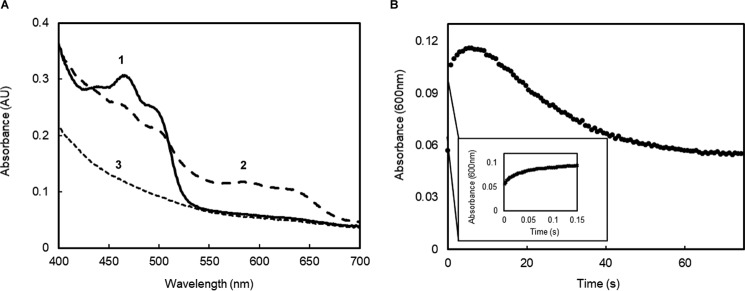
Figure 4.
Reduction of SfSIP using a ferredoxin. A, absorption spectral changes after mixing ferredoxin with SfSIP. Numbers in the figure indicate significant spectral features: 1) initial spectrum showing the typical features of oxidized SfSIP; 2) spectrum after 2 s, showing the typical features of the formation of the semi-quinone state of SfSIP; 3) final spectrum at 75 s, representing fully reduced SfSIP. B, time-resolved kinetic trace of SfSIP reduction followed at 600 nm.

