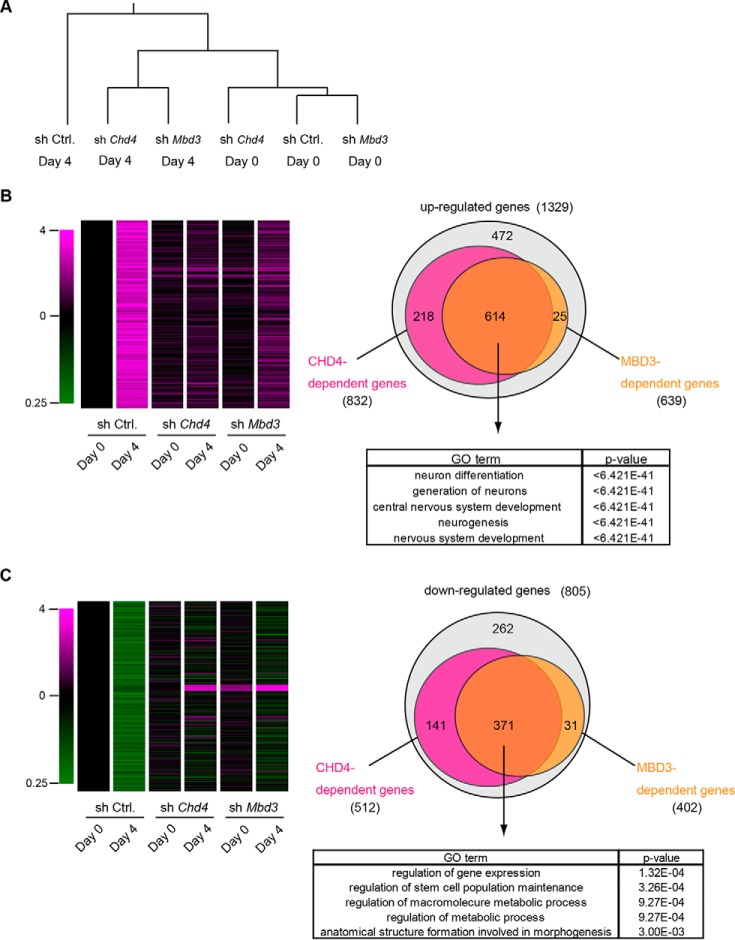
Figure 4.
Microarray analysis of CHD4- and MBD3-dependent genes during neural differentiation of ESCs. A, unsupervised hierarchical cluster analysis of gene expression profiles. B, heatmap for the 1329 genes whose expression was up-regulated by more than 2-fold during neural differentiation (left). Venn diagrams of 1329 genes (right, upper). The magenta and yellow circles represent CHD4- and MBD3-dependent up-regulated genes, respectively. GO analysis of CHD4- and MBD3-dependent up-regulated genes (right, lower). C, heatmap for the 805 genes whose expression was down-regulated less than half during neural differentiation (left). Venn diagrams of 805 genes (right, upper). The magenta and yellow circles represent CHD4- and MBD3-dependent down-regulated genes, respectively. GO analysis of CHD4- and MBD3-dependent down-regulated genes (right, lower).

