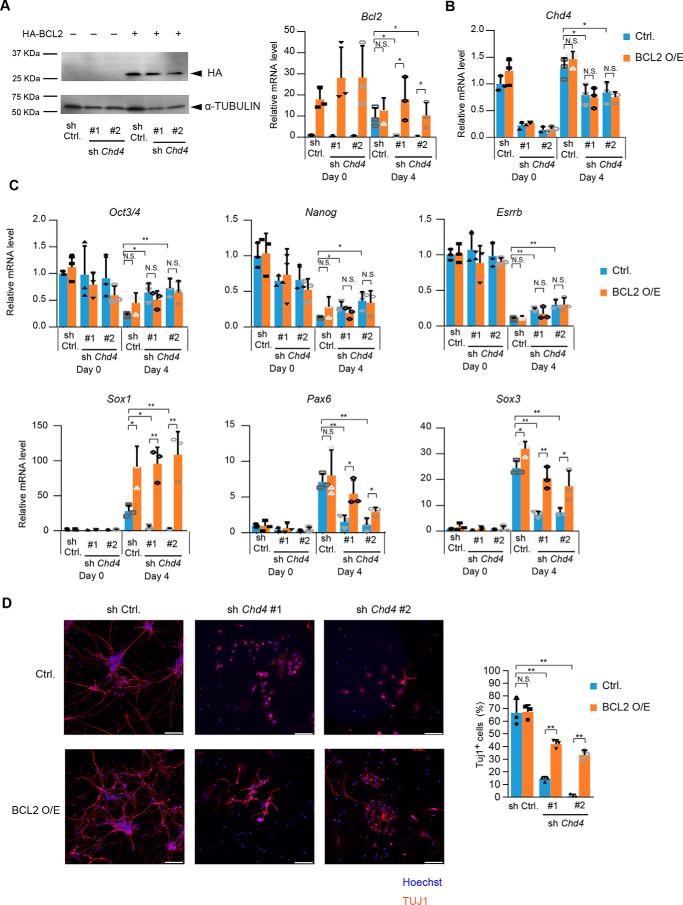
Figure 8.
CHD4–p53 axis regulates neural differentiation through BCL2 up-regulation. A, immunoblotting analysis for HA and α-tubulin (as a loading control) in control shRNA-, Chd4 shRNA-, and/or HA-BCL2-expressing cells at day 0 (left). qRT-PCR analysis is shown at right. Each mRNA level was normalized to the β-actin level, and the value of control shRNA-expressing cells at the 0 was set to 1. B and C, qRT-PCR analysis. Each mRNA level was normalized to the β-actin level, and the value of control shRNA-expressing cells at the 0 was set to 1. D, SFEBq-cultured cells at day 4 were transferred to dishes for further neural differentiation. Three days later (day 7), cells were stained for TUJ1 (left). The scale bars represent 100 μm. The percentages of TUJ1-positive cells are shown (right). A–D, data are shown as the means ± S.D. (n = 3 independent experiments). *, p < 0.05, and **, p < 0.01. The p values were calculated using Student's unpaired two-tailed t tests compared with control cells. In addition, the p values were calculated using Student's unpaired two-tailed t tests between control vector-expressing cells (blue bars) and BCL2-expressing cells (orange bars).

