Figure 1.
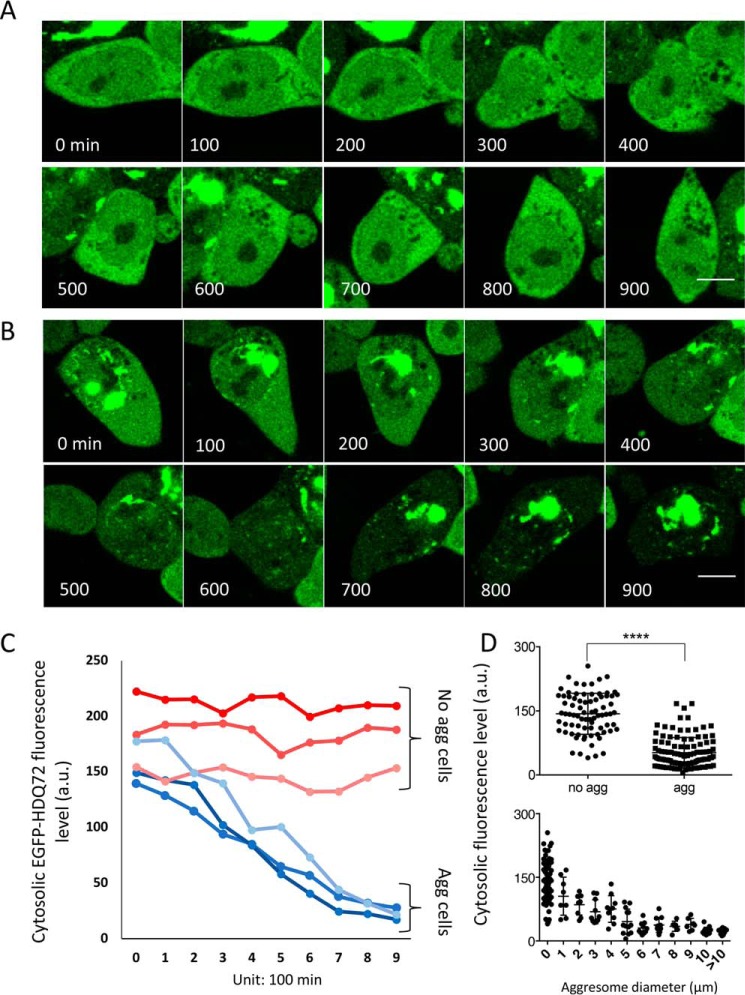
Perinuclear aggresomes sequester and deplete soluble EGFP-HDQ72 from the cytosol. A, time-lapse images of a cell in which no aggregation takes place over a period of 15 h (900 mins). There is no noticeable decrease of the cytosolic fluorescence signal, indicating that the concentration of EGFP-HDQ72 remains constant. Scale bar, 10 μm. B, time-lapse images recorded by confocal microscopy of an aggregate-containing cell over a time period of 15 h. The cytoplasmic concentration of soluble EGFP-HDQ72 protein is seen to decrease over time, as it is subsumed into the large perinuclear aggresome. Scale bar, 10 μm. C, plot of the fluorescence intensity change for recordings such as shown in A and B. Results are shown for three cell samples containing aggresomes (blue colors) and three that were devoid of aggresomes (red colors). D, upper panel, average fluorescence intensity from the cytosol of aggresome-free (n = 78) and aggresome-containing (n = 106) cells. The error bars correspond to standard deviations from the mean. **** indicates a p value of <0.0001 in an unpaired t test. Lower panel, correlation of average cytoplasmic fluorescence intensity with the size of perinuclear aggresomes observed (n = 106).

