Figure 2.
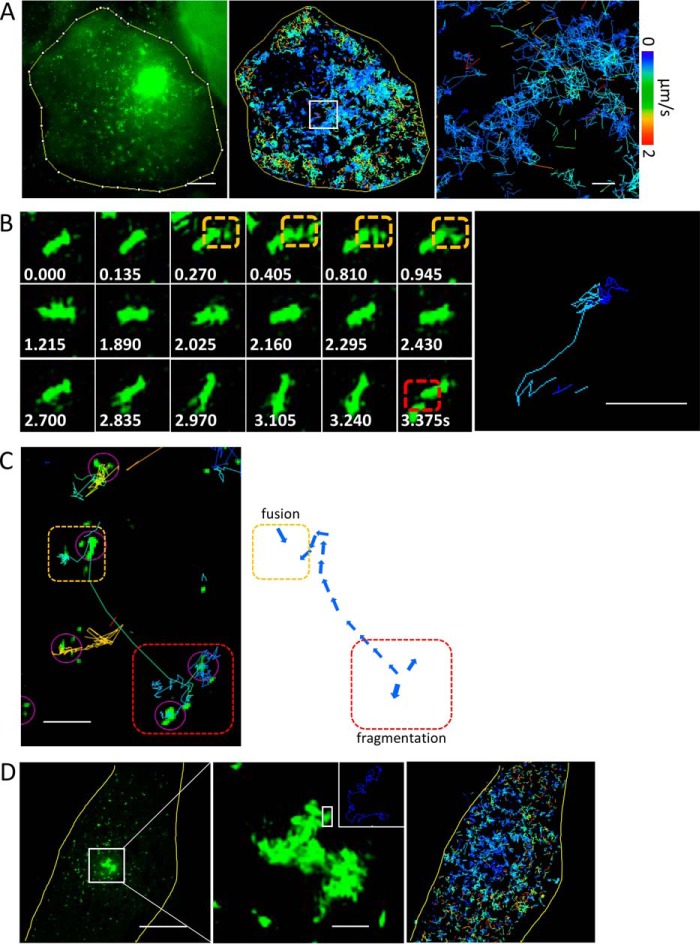
PolyQ aggregates undergo frequent fusion and fragmentation events in the cell. A, high-speed SIM recordings of intracellular aggregate dynamics. All small aggregates are subjected to dramatic random movements, which lead to collisions and contacts among clusters. Using an SPT algorithm, we identified individual particles and analyzed their trajectories in time at a frame rate of 5 Hz (middle panel). The right-hand panel shows a zoomed-in version of the region in the white rectangle. The velocity spectrum shown applies to all panels. Scale bars, 5 μm (left panel) and 1 μm (right panel). B, example images of individual particles in quasirandom motion (6 Hz). The image on the right demonstrates the aggregate trajectories. Numbers in white show the time (in seconds) of each frame. Dashed orange and red rectangles highlight fusion and fragmentation events, respectively. Scale bars, 500 nm. C, aggregate motion includes both active and passive transport components. The purple arrows highlight regions where small clusters where identified in the automated analysis. The dashed orange and red rectangles indicate regions where fusion and fragmentation take place, respectively. Scale bar, 2 μm. D, a cell containing an aggresome in the center and small aggregates in cytosol (left panel). A zoomed-in region shows that the loose clusters in the periphery of the aggresome are highly mobile (middle panel). The inset in the top right of the middle panel shows motion paths of individual fragments within the aggresome, which are highlighted in the white square. SPT reveals that the mobility of aggregate fragments is higher in the in the cytosol than in the aggresome (right panel). Scale bars, 5 μm (left panel) and 1 μm (middle panel).

