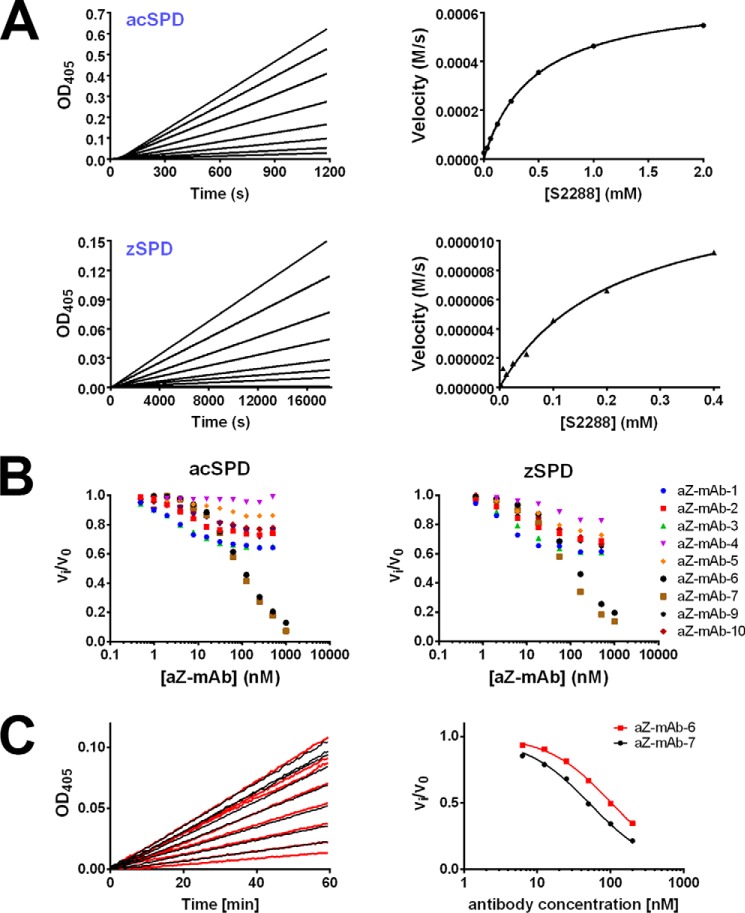
Figure 2.
The activity of acSPD and zSPD and the corresponding inhibitory effects of monoclonal antibodies on activity. A, activity of acSPD and zSPD shown by a dose-dependent enzyme activity assay (top left and bottom left, respectively) and the corresponding Michaelis–Menten fit (right panels) for 1 nm acSPD (top right) and 10 nm zSPD (bottom right) using 0–0.4 or 2 mm S-2288 substrate. Each graph is one representative experiment from at least three independent experiments. The zSPD has a lower Km and kcat than acSPD as a consequence of the higher concentration and lower activity. B, initial screening of inhibitory effects of the nine monoclonal antibodies toward both acSPD (left) and zSPD (right). An increasing concentration of antibody was incubated with either acSPD (50 pm) or zSPD (20 nm), and the residual rate of substrate conversion was measured by chromogenic assays (n = 3 for each data point of the shown curves). Antibodies aZ-mAb-6 and -7 are the most efficient inhibitors. C, Ki determinations of aZ-mAb-6 and aZ-mAb-7. acSPD (50 pm) was preincubated with a concentration series of the antibodies for 1 h, and the conversion of the chromogenic substrate S-2288 was monitored as the change in absorbance at 405 nm at 37 °C for 1 h (left). The Ki values for aZ-mAb-6 and -7 were 21 ± 2 and 9 ± 2 nm, respectively. The values for apparent Ki were determined by fitting the calculated reaction rates to Equation 2 (right) for competitive inhibition and then converting into the Ki value using Equation 3.

