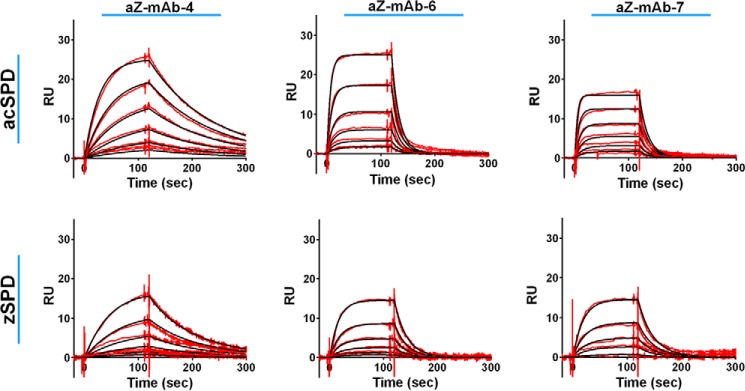
Figure 3.
Determination of the equilibrium constant by surface plasmon resonance experiments. KD measurements where the red lines represent the binding curves and the black lines represent the corresponding 1:1 fit were performed by the Biacore evaluation software. The individual monoclonal antibodies were captured on an anti-mouse IgG surface before acSPD (top) or zSPD (bottom) was injected. The concentration range of acSPD was 1.56–50 nm for aZ-mAb-6 and -7 and 0.78–25 nm for aZ-mAb-4. For zSPD, a concentration range of 0.94–30 nm was used for all three antibodies. Each sensorgram represents one representative of at least three independent experiments.

