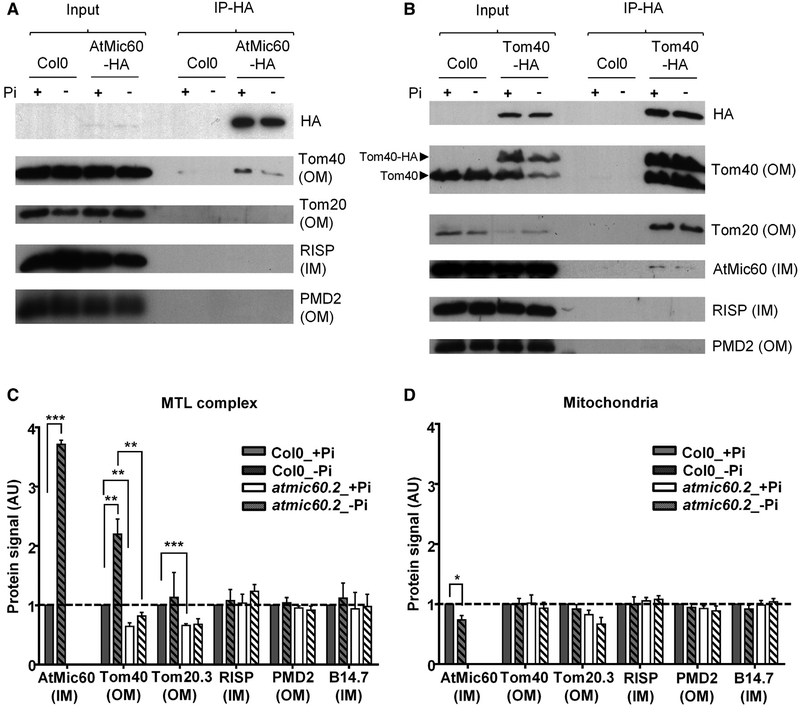
Figure 4. AtMic60 and Tom40 Interact Together and Are More Abundant in the MTL Complex during Pi Starvation.
(A and B) Co-immunoprecipitation (coIP) experiments with anti-HA antibodies on mitochondria purified from calli grown 4 days in +Pi or in −Pi. CoIPs were done with 500 μg (A) or 300 μg (B) of proteins, and 3 μg of proteins was used for input.
(A) CoIPs with Col0 (control) and atmic60.2+AtMic60-HA mitochondria (Figure S3C) are shown.
(B) CoIPs with Col0 (control) and Col0+Tom40-HA mitochondria (Figure S3D) are shown.
(C and D) Quantification of the protein signals obtained in western blots in Figure S4 in the MTL complex (C) and in the whole mitochondria (D) of Col0 and atmic60.2 calli grown 4 days in + or in −Pi. The quantified signals were normalized with Col0 +Pi signal. Data represent the mean value ± SEM; n = 3.
See also Figures S3 and S4.

