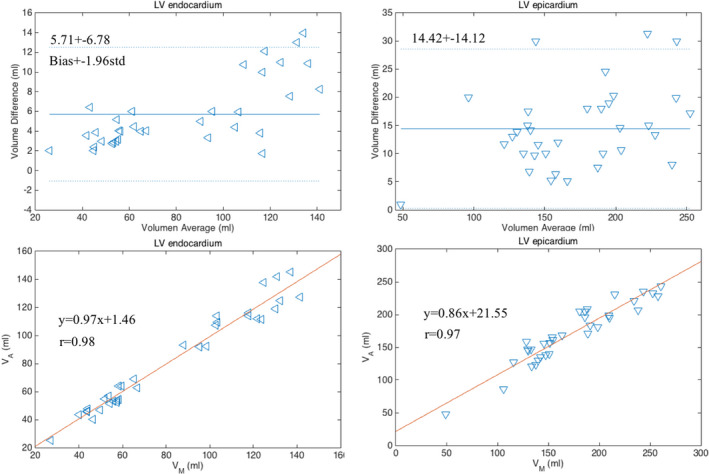
Figure 6.

Bland–Altman and linear regression plots of the measurements of LV endocardial and epicardial volumes obtained with manual and proposed segmentation methods on 17 cases at two cardiac phases (end‐diastole and end‐systole). [Color figure can be viewed at wileyonlinelibrary.com]
