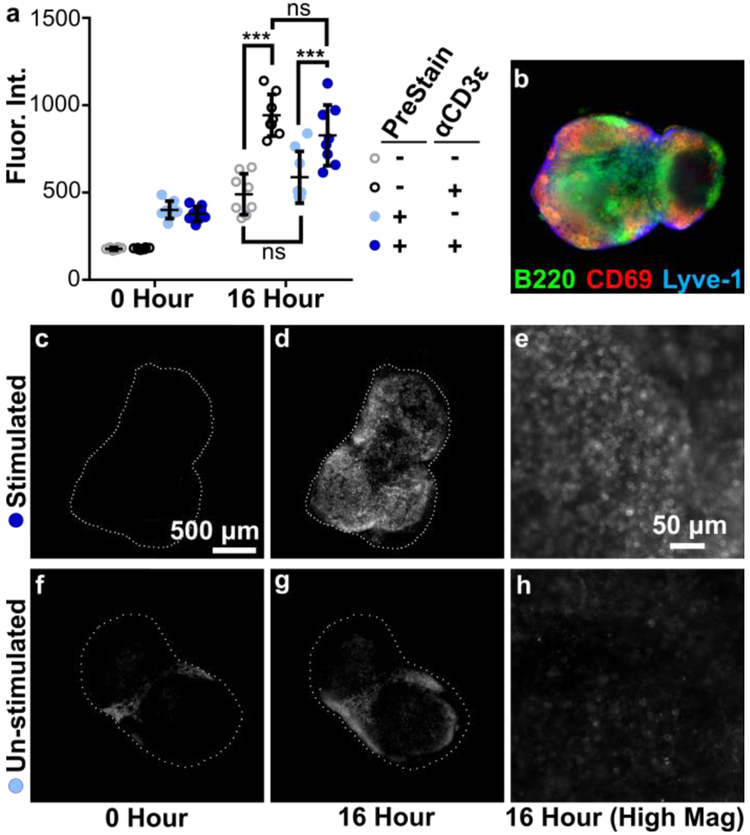
Figure 3.
Live immunostaining of LN slices before and after CD3 stimulation revealed increase of CD69 surface markers. Live LN’s were sliced and stained before stimulation (PreStain) to observe baseline in CD69 presentation. Slices were cultured and stimulated with anti-CD3ε and then stained again. (a) Mean fluorescent intensity of CD69 signal, averaged across the entire tissue, imaged before (0 Hour) and after stimulation (16 Hour). Data compiled from 2 replicate experiments, N=8 slices per condition, 2-way ANOVA analysis with Sidak multiple comparison. *** indicates p < .001. Error bars denote standard deviation, (b) A composite image of a representative slice after anti CD3ε stimulation, showing overlaid data for B220, Lyve-1, and CD69.(c-h) Representative single-channel images of Alexa Fluor 647 anti-CD69 data: PreStained + α.CD3ε (c) before and (d) after culture, and (e) high magnification after culture in the same slice; PreStained - α.CD3ε (f) before and (g) after culture, and (h) high magnification after culture in the same slice. Brightness and contrast uniformly adjusted for images (c,d,f, and g) and uniformly adjusted for (e and h). Dashed white lines show the outline of the tissue slice. Scalebar in (c) applies to (b-d,f, and g).

