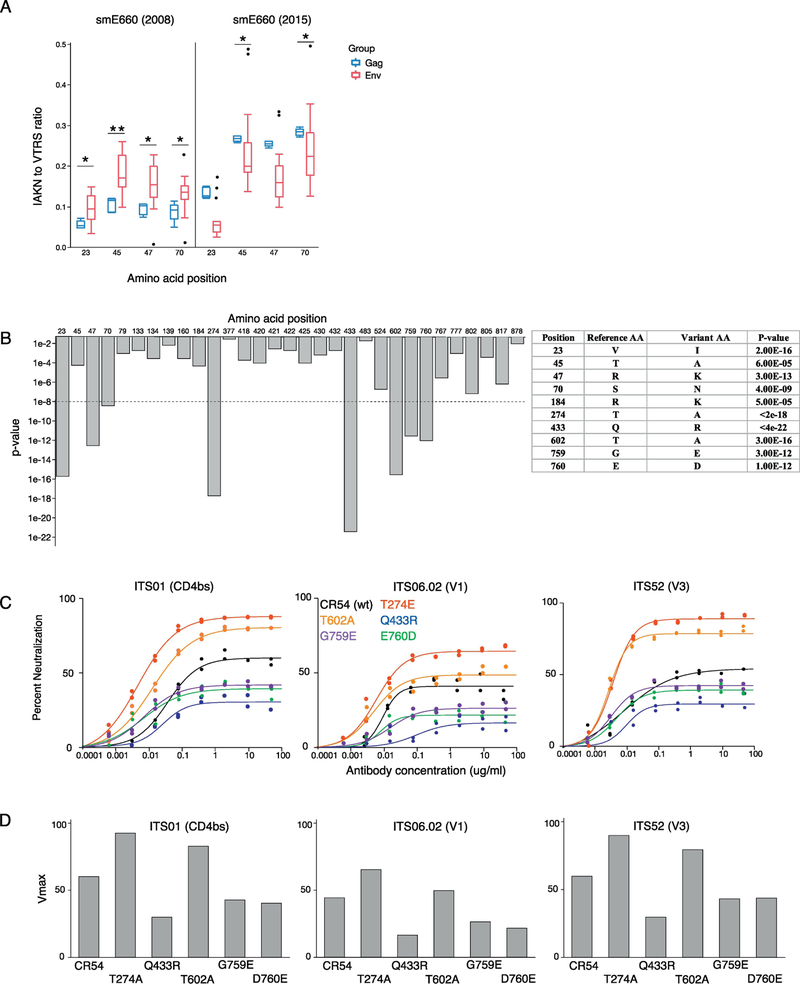
Fig. 2.
In vitro sieving assay using VRC332 sera. (A) IAKN to VTRS ratios in SIVsmE660 (2008) and SIVsmE660 (2015) sieving assay. Blue boxes show ratios in Gag vaccinated sera and red boxes shows ratios in Env vaccinated sera. P-values: ** ≤ 0.01 < * ≤0.05 (Mann-Whitney). (B) The bar graph shows amino acid residues with p-values < .05 between Gag and Env vaccinated groups. The table is the list of amino acid variants with uncorrected p values < 6 × 10⁻⁵. Other than the first four, these variants were not found in the 2008 stock. (C) Neutralization curves of CR54 single mutants against ITS01 (CD4bs), ITS06.02 (V1) and ITS52 (V3). Black: CR54, Red: T274A, Blue: Q433R, Orange: T602A, Violet: G759E and Green: E760D (D) Vmax of single CR54 mutants calculated based on the neutralization curves.

