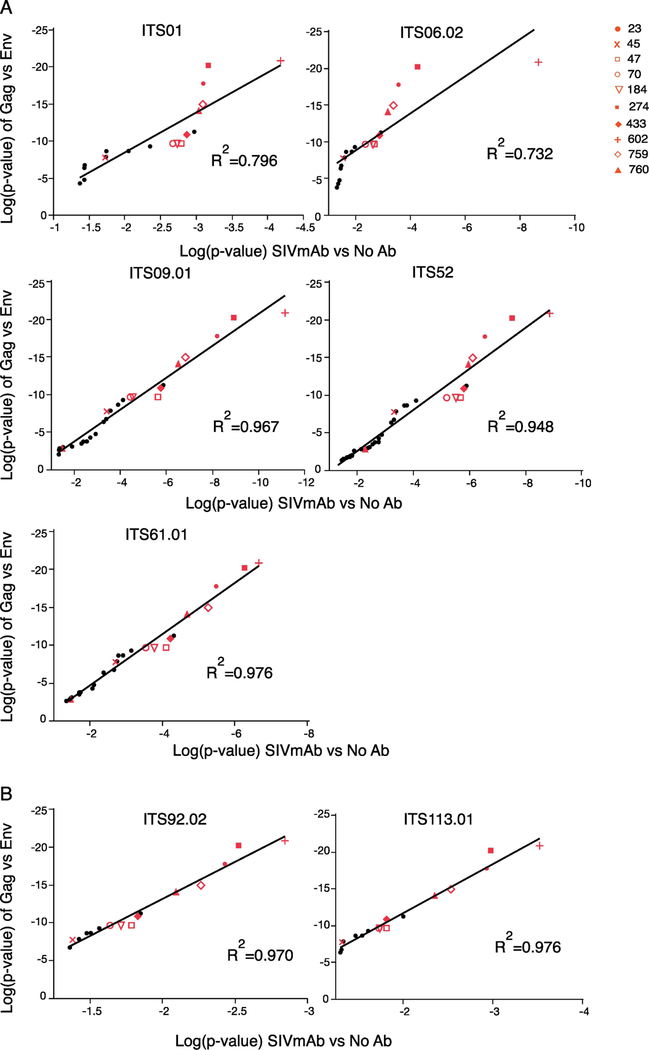
Fig. 4.
SIVsmE660 (2015) sieving assay using SIVmAb and VRC332 sera. Ratios of Env variants were statistically analyzed between Gag and Env vaccinated animals or SIVmAb and no antibody samples by Mann-Whitney U test. Variants selected with significant p-value were converted into log and plotted on graphs. R-squared is shown on the graph. Red plots demonstrate variants that were selected with significant p-value in sieving assay using VRC332 sera. (A) Correlation of log(p-value) between Env and 1st generation SIVmAb (B) Correlation between log(p-value) of Env and 2nd generation SIVmAb.

