Figure 1.
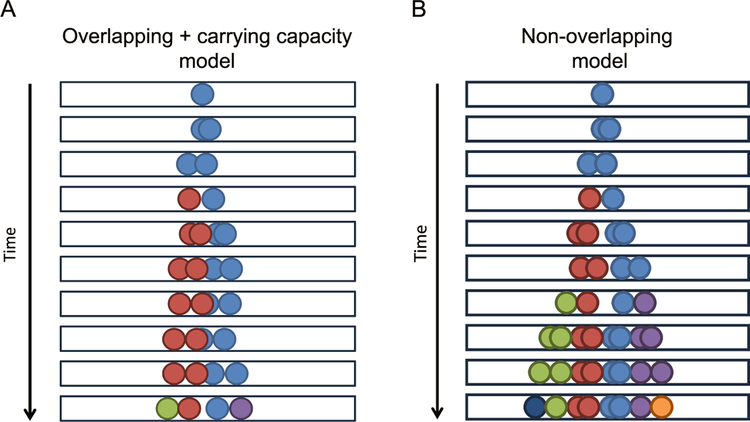
Diagram of overlapping + carrying capacity and non-overlapping models. (A) Overlapping + carrying capacity model diagram. Black boxes indicate the 1D space which cells were permitted to occupy. The initial cell, colored light blue, is able to diffuse and grow, indicated by the two spheres of the same color moving gradually apart. As time advances, the cell undergoes division, indicated by the arrival of a new cell color. When multiple cells are present (each distinct cell is represented by two spheres of the same color), cells are unable to divide if they are currently overlapping, which effectively imposes a local carrying capacity. The simple overlapping model (not shown) permits cell movements and cell division events without regard for the presence of other cells (i.e. lacks a carrying capacity). (B) Non-overlapping model diagram. Similar to (A), the same rules apply, except that individual cells are not allowed to overlap with each other. As mentioned above, the two overlapping circles of the same color in the diagram represent a single cell prior to division. Once divided, one of the two nascent daughter cells changes color (e.g. from light blue to red in the first division). In this model, cell division events are not accepted if the resulting daughter cells would overlap with any neighboring cells, thus influencing the observed proliferation.

