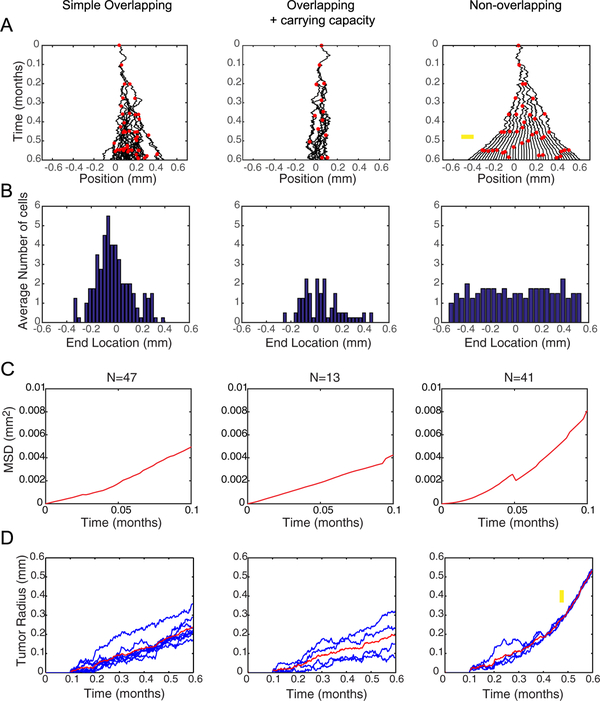
Figure 2.
Spatio-temporal dynamics of the three BD tumor progression models. (A) Progeny trees of the three models using the same input parameters where D0 = 20 μm2 h−1 and p0 = 10 divisions/month. Black curves indicate the trajectories of cells. Red dots indicate the time and position of a division event. On this time scale, unimpeded cell proliferation would generate exactly 6 generations of cells. Yellow arrow on the non-overlapping model indicates where jamming begins. (B) Distributions of cell locations at the end of a simulation (t = 0.6 months) were averaged over four simulations. The Gaussian distributions in the overlapping models are characteristic of diffusion, while the uniform distribution of the non-overlapping models indicates non-diffusive behavior. (C) Plots of average MSD over time for the cells within a single simulation. Since only the initiating cell lasts the duration of the entire simulation, only the beginning of the MSD plots are shown. At longer times, more variability is introduced because fewer data points exist. Linear behavior indicates a purely diffusive process, asymptotic behavior (i.e. concave down) indicates a subdiffusive process, and upward concavity (as in the non-overlapping model) indicates a superdiffusive/ballistic process. (D) Tumor radius over time for multiple simulations evaluated at D0 = 20 μm2 h−1 and p0 = 10 divisions/month in each model show the overlapping models progress linearly with time. The non-overlapping model progresses linearly, similar to the overlapping models, then the slope of the linear progression suddenly increases after the simulation reaches a jammed configuration, as indicated by the yellow arrow. Thus, the non-overlapping model predicts fundamentally distinct tumor progression dynamics, and faster growth for the same input parameter values, as compared to the overlapping models.

