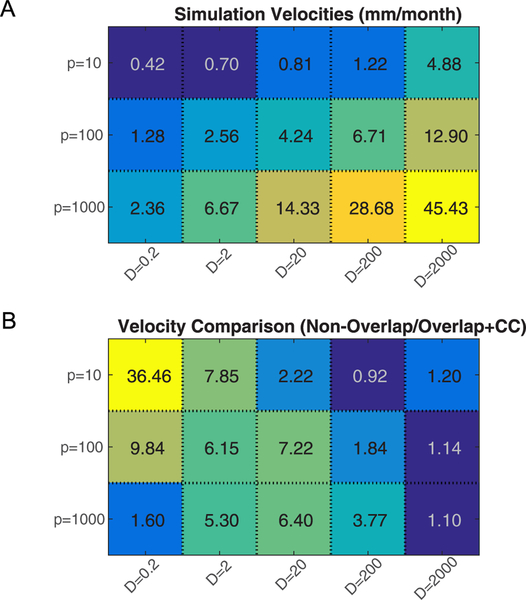
Figure 4.
Comparison of velocity values between the overlapping + cc and non-overlapping models. (A). Tumor margin velocities of the non-overlapping model with different parameter values. Values are averaged over multiple simulations (n = 4) and displayed in units of mm/month. (B) Velocities of the non-overlapping model and overlapping + cc model with the same set of parameters are compared. Values in the heatmap are calculated as the ratio of the average velocity of non-overlapping (n = 4) to the average velocity of overlapping + cc (n = 4) from the data presented in figure 3(C). Over a wide range of parameter space, the non-overlapping model predicts a much larger tumor margin velocity than the overlapping + cc model.

