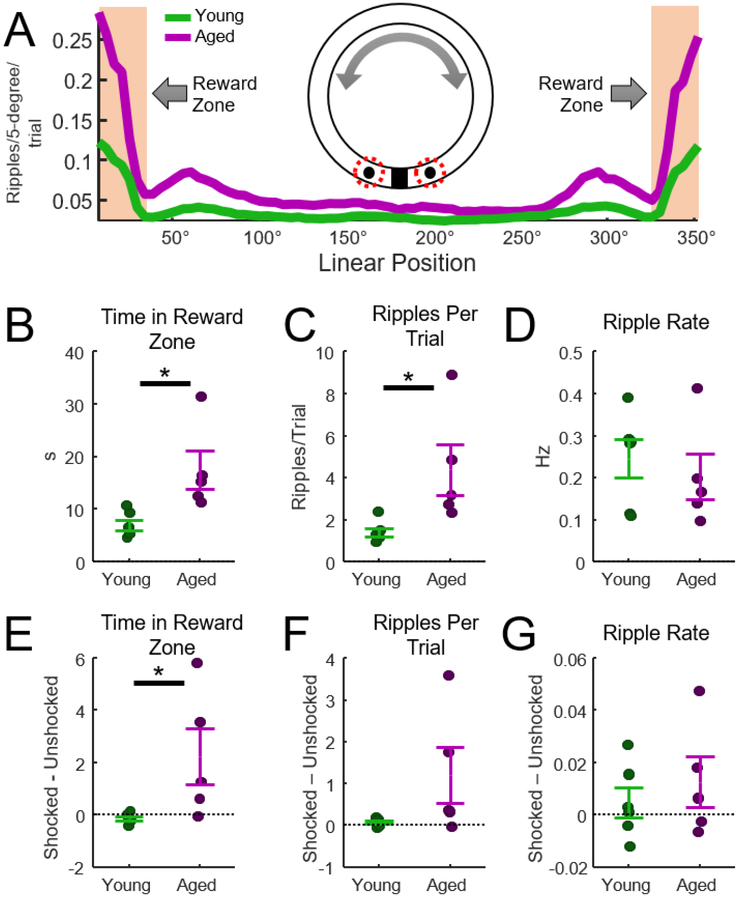
Figure 2.
Analysis of ripples at reward zones. A) Average number of ripples per trial at each location on the track (clockwise and counterclockwise trials were combined). The number of ripples/trial was largest when animals were in the reward zones (shaded region). Clockwise and counterclockwise trials were combined in this analysis, making this plot symmetrical. Values were not normalized by time spent at the reward zone (see Figure 6B). B) Aged rats spent significantly more time in the reward zones (t-test, t = −3.0, p = 0.02, d = −1.7, n = 6 young, n = 5 aged rats). C) There were significantly more ripples per trial for the aged rats (t = −2.7, p = 0.03, d = −1.5). D) The rate of ripple events in the reward zone was not different between aged and young rats (p = 0.36). E) Comparison of total time spent in the feeder zone after rats did or did not receive an eye shock. Aged rats spent more time in the feeder zone relative to young rats (t = −2.4, p = 0.04, d = −1.4). F) The number of ripples per trial did not differ between trials with and without eye shocks (p = 0.1). G) The rate of ripple events did not differ between trials with and without eye shocks (p = 0.5).

