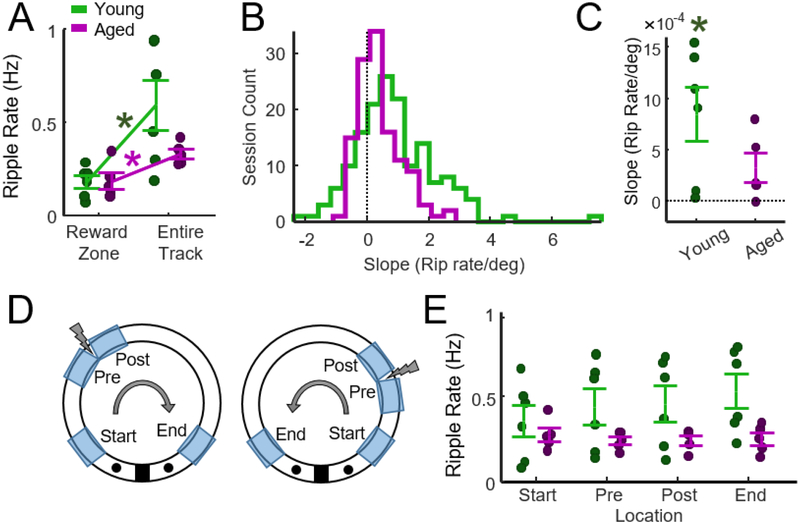
Figure 4.
Changes in ripple rate during track running and reward consumption. A) Although more ripples occurred when rats were in the Reward Zone, ripple rates were lower in the reward zone relative to track running. Paired t-tests indicated that both aged and young rats expressed higher ripple rates during track running (p young = 0.03, p aged= 0.03, Bonferroni-Holm correction). B) The slope of the regression line that fit the relationship between location (degrees) and ripple rate (Fig. 3F) was used to determine whether ripple rates increased as animals approached the reward zone. A positive slope indicates that ripple rate increased as animals approached the reward zone. The histograms present slopes for all analyzed sessions (n = 146 young, n = 119 aged). C) Slopes for young and aged rats did not differ (two-sample t-test, t = 1.6, p = 0.14, n = 6 young, n = 5 aged). Slopes for young (one-sample t-test, p = 0.048), but not aged (p = 0.089) rats were greater than zero (p values Bonferroni corrected for 2 tests). D) Schematic of zones on the track used to identify changes in ripple rate as a function of location. Each zone was 30° in extent. Clockwise and counter clockwise journeys were combined. E) Average ripple rate at each location on the track. Two-way ANOVA (age x location) revealed a main effect of age (F = 11.3, p = 0.002) but not location (F = 0.3, p = 0.83) and no interaction (F = 0.52, p = 0.67).

