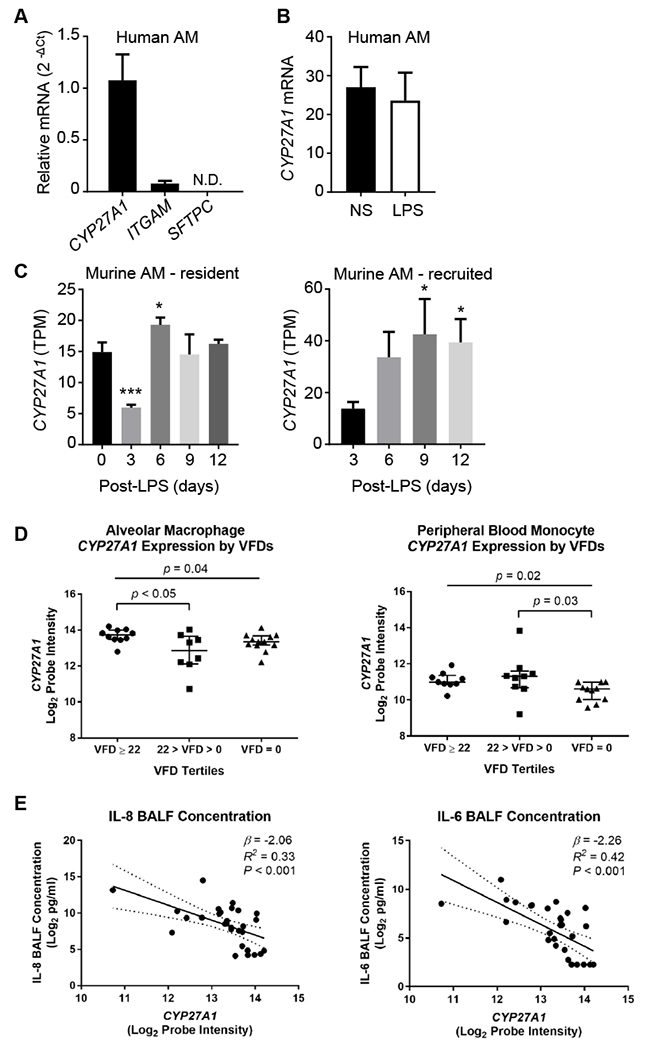
Figure 1. Relationship of alveolar macrophage and monocyte CYP27A1 to ARDS severity.

(A) Expression of indicated transcripts in alveolar macrophages (AMs) from normal, nonsmoking volunteers (N=5). Integrin subunit alpha M (ITGAM [CD11b]) is a positive control; SFTPC (surfactant protein C), a negative control. (B) AMs from volunteers (N=4) were non-stimulated (NS) or treated with 10 ng/ml lipopolysaccharide (LPS) for 4h, and CYP27A1 mRNA quantified. (C) C57BL/6 mice were exposed i.t. to 20 μg LPS. Resident (CD64+F4/80+CD11chighCD11blow) and recruited (CD64+F4/80+CD11clowCD11bhigh) AMs were purified from bronchoalveolar lavage at indicated times, and CYP27A1 transcripts per million (TPM) quantified by RNA-Sequencing. Data are mean +/− S.D. *, P<0.05; ***, P<0.001 (comparison: day 0 for resident; day 3 for recruited). (D) AMs (N=30, left) and peripheral blood monocytes (N=29, right) were isolated from patients <48h after development of ARDS. The relationship between normalized log2 CYP27A1 expression and ventilator-free days (VFDs) was tested. Only comparisons with P<0.05 are displayed. Individual values, median, and interquartile ranges are depicted. (E) AMs as in panel D were plotted in relation to bronchoalveolar lavage fluid (BALF) IL-8 and IL-6. Depicted are regression lines and 95% confidence intervals (solid and dashed lines), β coefficients, R2 values, and P values.
