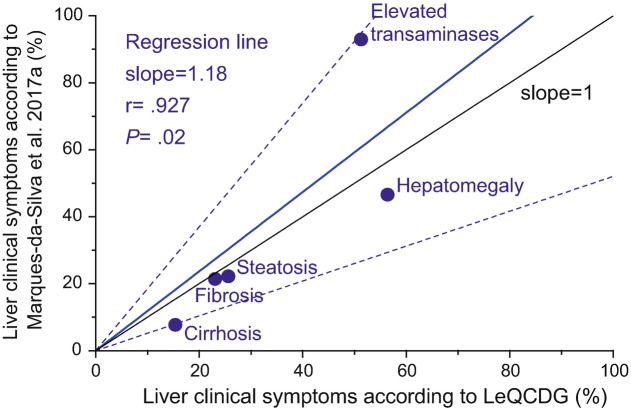
Fig. 3.
Scatterplot and regression line (in blue) for the relation between the prevalence of liver symptoms in PMM2-CDG patients obtained from LeQCDG results and from literature data (Marques-da-Silva et al. 2017a). The slope of the regression line was found 1.18 ± 0.24. The 95% confidence interval is plotted as confidence bands (dashed lines) around the regression line. Pearson’s correlation coefficient (r) and observed significance of the test (P) are indicated. The line with slope = 1 corresponds to perfect agreement between both methods

