Fig. 6.
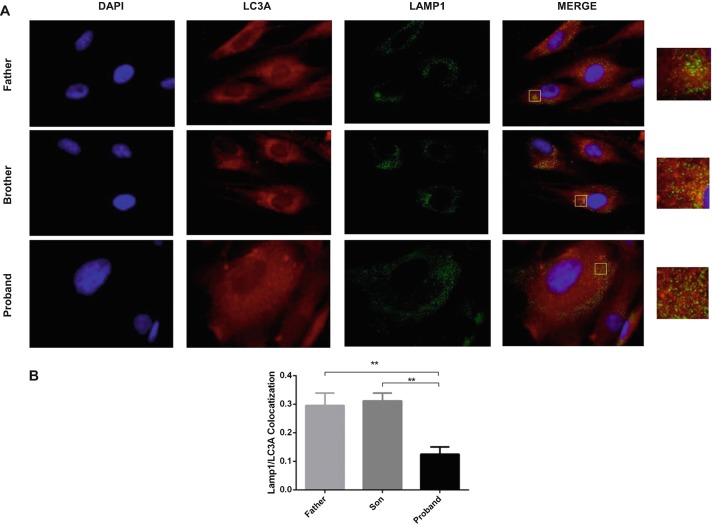
Autophagosomes and lysosomes failed to fuse in saposin A patient fibroblasts compared to healthy controls (father and brother). (a) Double immunocytochemical staining of fibroblast cells showed the colocalization of LC3A with LAMP-1 antibodies by fluorescence microscopy. LC3A protein was visualized in red, LAMP1 in green, and nucleus in blue. Yellow signal signifies colocalization of LC3A and LAMP-1. In order to better visualize the fluorescent signals present within the large merged images, zoom images were shown. Fusion between autophagosomes and lysosomes (yellow) was evident in healthy fibroblast cells, but very little in proband fibroblast cells. Colocalization analysis of LC3 with LAMP-1-labeled lysosomes was performed on ImageJ based on Coloc 2 analysis and Pearson value (b). The data are represented as the mean ± S.E.M. One-way ANOVA was used for statistical analysis (**p < 0.025)

