Fig. 3.
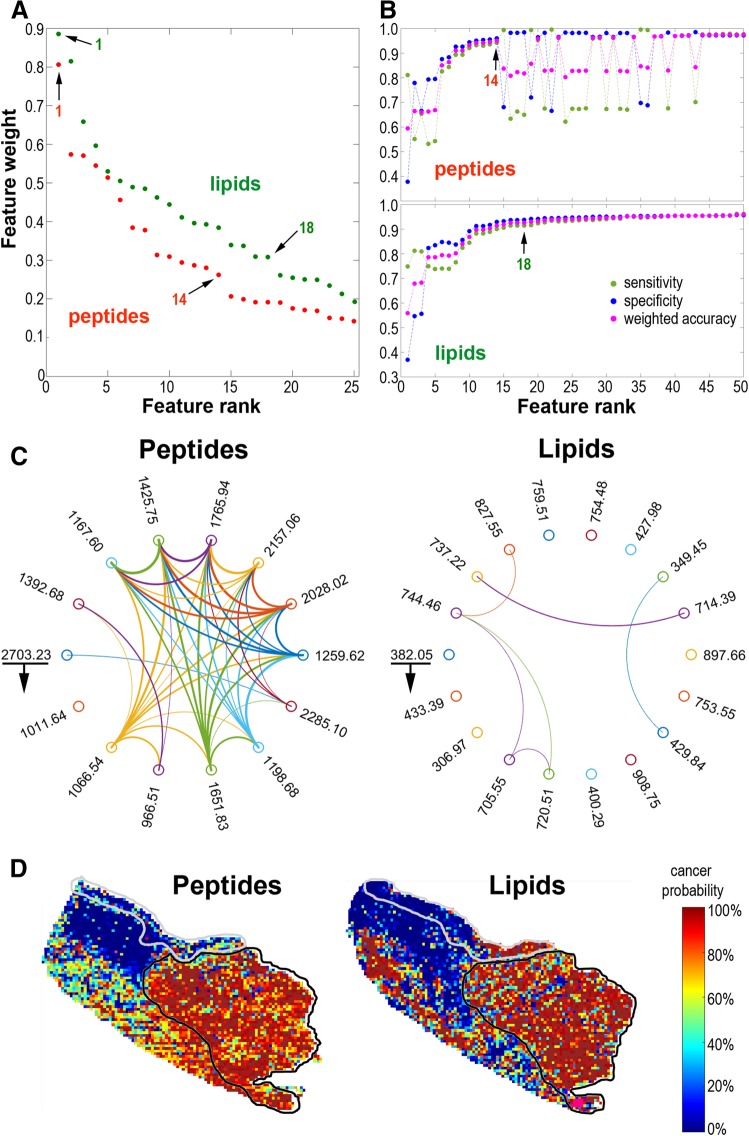
Cancer classifier based on components detected by MALDI–MSI. a Rank of top 50 components with decreasing weight in the tested classifiers. b Performance of classifiers (sensitivity, specificity, and weighted accuracy) built with panels of features with an increased number of components. c Pairwise correlation plot for 14 peptide and 18 lipid components selected for the final classifiers (underlined are top components with the counterclockwise decreasing weight of a component); connected are components of at least high effect size correlation (width of the line represents the strength of the correlation). d Results of classification of basic segments (registered spectra) in the validation sample (Case_4); the heat maps illustrate the probability of being classified as < cancer> (grey and black lines delineate expert-determined normal epithelium and cancer, respectively). (Color figure online)

