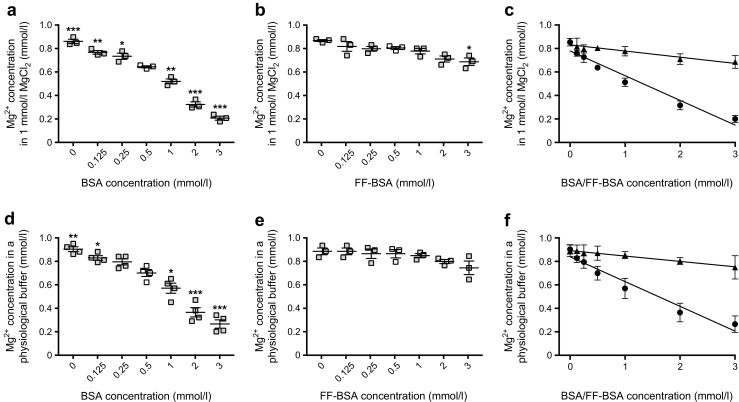
Fig. 2.

Binding of Mg2+ to albumin is NEFA-dependent. (a, b) The Mg2+ concentration in an increasing level of BSA (a) or FF-BSA (b) dissolved in a MgCl2 solution. The white squares indicate a BSA/FF-BSA concentration (0.5 mmol/l) that is near the physiological range; all other data points are shown in grey. (c) Linear regression analyses of the Mg2+ concentration in increasing levels of BSA (circles; y = −0.21x + 0.78, r2 = 0.96, p ≤ 0.05) or FF-BSA (triangles; y = −0.05x + 0.83, r2 = 0.90, p ≤ 0.05), using data shown in (a) and (b). (d, e) The Mg2+ concentration in an increasing level of BSA (d) or FF-BSA (e) dissolved in a physiological buffer. The white squares indicate a BSA/FF-BSA concentration (0.5 mmol/l) that is near the physiological range; all other data points are shown in grey. (f) Linear regression analyses of the Mg2+ concentration in increasing levels of BSA (circles; y = −0.21x + 0.78, r2 = 0.96, p ≤ 0.05) or FF-BSA (triangles, y = −0.05x + 0.83, r2 = 0.90, p ≤ 0.05), using data shown in (d) and (e). Data are mean ± SEM of three replicate experiments. *p ≤ 0.05, **p ≤ 0.01, ***p ≤ 0.001 vs Mg2+ concentrations in 0.5 mmol/l BSA/FF-BSA. Significance was evaluated using a one-way ANOVA with Dunnett’s correction for multiple comparisons (a, b, d, e) or using a linear regression analysis (c, f)
