

Abstract
Deficiencies in N‐methyl‐d‐aspartate (NMDA)/glutamate receptor (NMDAR) signaling have been considered central to the cognitive impairments of schizophrenia; however, an NMDAR antagonist memantine (MEM) improves cognitive impairments of Alzheimer's disease and schizophrenia. These mechanisms of paradoxical clinical effects of NMDAR antagonists remain unclear. To explore the mechanisms by which MK801 and MEM affect thalamocortical transmission, we determined interactions between local administrations of MK801, MEM, system xc− (Sxc), and metabotropic glutamate receptors (mGluRs) on extracellular glutamate and GABA levels in the mediodorsal thalamic nucleus (MDTN) and medial prefrontal cortex (mPFC) using dual‐probe microdialysis with ultra‐high‐pressure liquid chromatography. Effects of MK801 and MEM on Sxc activity were also determined using primary cultured astrocytes. Sxc activity was enhanced by MEM, but was unaffected by MK801. MK801 enhanced thalamocortical glutamatergic transmission by GABAergic disinhibition in the MDTN. In the MDTN and the mPFC, MEM weakly increased glutamate release by activating Sxc, whereas MEM inhibited thalamocortical glutamatergic transmission. Paradoxical effects of MEM were induced following secondary activation of inhibitory II‐mGluR and III‐mGluR by exporting glutamate from astroglial Sxc. The present results suggest that the effects of therapeutically relevant concentrations of MEM on thalamocortical glutamatergic transmission are predominantly caused by activation of Sxc rather than inhibition of NMDAR. These demonstrations suggest that the combination between reduced NMDAR and activated Sxc contribute to the neuroprotective effects of MEM. Furthermore, activation of Sxc may compensate for the cognitive impairments that are induced by hyperactivation of thalamocortical glutamatergic transmission following activation of Sxc/II‐mGluR in the MDTN and Sxc/II‐mGluR/III‐mGluR in the mPFC.
Keywords: cystine/glutamate antiporter, mediodorsal thalamic nucleus, memantine, schizophrenia
Abbreviations
- ACSF
artificial cerebrospinal fluid
- ANOVA
analysis of variance
- CPG
(S)‐4‐carboxyphenylglycine
- CPPG
(RS)‐α‐cyclopropyl‐4‐phosphonophenyl glycine
- fDMEM
Dulbecco's modified Eagle's medium containing 10% fetal calf serum
- III‐mGluR
group III metabotropic glutamate receptor
- II‐mGluR
group II metabotropic glutamate receptor
- LME
linear mixed effects model
- MDTN
mediodorsal thalamic nucleus
- MEM
memantine
- mGluR
metabotropic‐glutamate receptors
- mPFC
medial prefrontal cortex
- MRS
modified Ringer's solution
- MUS
muscimol
- NAC
N‐acetyl‐l‐cysteine
- NMDAR
N‐methyl d‐aspartate receptor
- RTN
reticular thalamic nucleus
- Sxc
system cysteine/glutamate antiporter
- UHPLC
ultra‐high‐performance liquid chromatography
1. INTRODUCTION
Abnormalities of glutamatergic transmission play widely accepted roles in the pathophysiology of schizophrenia, as indicated by the induction of schizophrenia‐like positive and negative symptoms following treatments of healthy volunteers with N‐methyl d‐aspartate receptor (NMDAR) antagonists such as phencyclidine and ketamine,1 and the exacerbation of psychosis in patients with schizophrenia.2 Moreover, NMDAR antagonist‐induced psychosis models exhibit features of schizophrenia, such as negative symptoms and cognitive deficits, more accurately than amphetamine/dopamine psychosis models.3 Based on these clinical and preclinical evidences, hypo‐glutamatergic transmission via NMDAR inhibition is sufficient to produce a schizophrenia‐like state. A meta‐analysis of NMDAR agonists as adjunctive therapies for schizophrenia accordingly showed that NMDAR agonists are superior to placebo in terms of overall and negative symptoms.4 In contrast with NMDAR agonists, the NMDAR antagonists amantadine and memantine (MEM) improved cognitive impairments of schizophrenia according to another meta‐analysis,5 and adjuvant medication with MEM and antipsychotics was effective on positive, negative, and cognitive symptoms in schizophrenia.6, 7 Other clinical studies demonstrate clinical benefits of MEM against several psychiatric disorders, including mood and anxiety disorders and schizophrenia.8
The mechanisms behind the clinical discrepancies between psychotomimetic NMDAR antagonists and MEM remain poorly understood. Although MEM is predominantly considered a NMDAR inhibitor,9 other pharmacological studies show that MEM inhibits 5‐HT3, nicotinic α7, α4β2 receptors, monoamine oxidases, and transporters of serotonin and dopamine.8, 9, 10 Preclinical studies similarly show attenuation of methylmercury‐induced neurotoxicity by MEM, involving NMDAR antagonist and indirect antioxidant activities, and likely inhibition of the reduction of nonenzymatic (nonprotein sulfhydryl) and enzymatic (superoxide dismutase and glutathione peroxidase) antioxidants.11 Glutathione is synthesized by glutamate‐cysteine ligase and glutathione synthase from cysteine, which is transported through the cystine/glutamate antiporter system xc− (Sxc).12 MEM also had neuroprotective effects in patients with ischemic stroke13 and quantitative proteomic analyses demonstrated that phencyclidine upregulated phosphorylation of the light chain of Sxc in the prefrontal cortex of rats, although the related kinase was not identified.14
Based on these clinical and preclinical studies, we investigated the antipsychotic mechanisms of MEM with a special focus on the mPFC hyper‐glutamatergic hypothesis of schizophrenia. For this purpose, we (1) determined the effects of MK801 and MEM following local administrations of the mediodorsal thalamic nucleus (MDTN) and the mPFC on thalamocortical (from MDTN to mPFC) transmission, including release of l‐glutamate and GABA. Furthermore, we (2) demonstrated interactions between MEM, MK801, Sxc, metabotropic glutamate receptor (mGluR), and GABAA receptor on thalamocortical transmission. These two studies were generated in analyses of thalamocortical glutamatergic transmission using dual‐probe microdialysis experiments in freely moving rats with ultra‐high‐performance liquid chromatography (UHPLC). We then (3) determined the effects of MK801 and MEM on Sxc activity using primary cultured astrocytes.
2. MATERIALS AND METHODS
2.1. Chemical agents
NMDAR antagonist, MK801,15 memantine (MEM), cysteine prodrug, N‐acetyl‐l‐cysteine (NAC),16 and the GABAA receptor agonist, muscimol (MUS)15 were obtained from Wako Chemicals (Osaka, Japan). The II‐mGluR antagonist LY341495,17 the III‐mGluR antagonist (RS)‐α‐cyclopropyl‐4‐phosphonophenyl glycine (CPPG),17 and the Sxc inhibitor (S)‐4‐carboxyphenylglycine (CPG)18 were purchased from Tocris Bioscience (Bristol, UK).
All compounds were prepared on the day of experiments. MK801, MEM, CPPG, CPG, NAC, and MUS were dissolved in modified Ringer's solution (MRS) or artificial cerebrospinal fluid (ACSF). LY341495 was initially dissolved in 10 mmol L−1 dimethyl sulfoxide and was then diluted to 1 mmol L−1 in MRS. The final concentrations of LY341495 and dimethyl sulfoxide were 1 μmol L−1 and 0.1% (vol vol−1), respectively.
MRS contained 145 mmol L−1 Na+, 2.7 mmol L−1 K+, 1.2 mmol L−1 Ca2+, 1.0 mmol L−1 Mg2+, and 154.4 mmol L−1 Cl−. The pH was adjusted to 7.4 using 2 mmol L−1 phosphate buffer and 1.1 mmol L−1 Tris buffer.19, 20 ACSF contained 130 mmol L−1 NaCl, 5.4 mmol L−1 KCl, 1.8 mmol L−1 CaCl2, 1 mmol L−1 MgCl2, and 5.5 mmol L−1 glucose and was buffered to pH 7.3 using 20 mmol L−1 HEPES.
2.2. Preparation of the microdialysis system
All animal care and experimental procedures were performed in compliance with the Ethical Guidelines established by the Institutional Animal Care and Use Committee at Mie University (No. 29‐22). All studies involving animals are reported in accordance with the ARRIVE guidelines for reporting animal experiments21 and a total of 210 rats were used.
Male Sprague‐Dawley rats of 225‐275 g and 7‐8 weeks of age (SLC, Shizuoka, Japan) were maintained in a controlled environment (22 ± 1°C) with a 12 hour dark/12 hour light cycle. All rats were weighed prior to the start of experiments. Rats were anesthetized with 1.8% isoflurane and were then placed in a stereotaxic frame for 1 hour. Concentric direct insertion type dialysis probes were implanted in the mPFC (A = +3.2 mm, L = +0.8 mm, V = −5.2 mm, relative to bregma; 0.22 mm diameter, 3 mm exposed membrane: Eicom, Kyoto, Japan) and the MDTN (A = −3.0 mm, L = +0.9 mm, V = −6.2 mm, relative to bregma; 0.22 mm diameter, 2 mm exposed membrane: Eicom).22 Following surgery, rats were housed individually in cages during recovery and experiments, and were provided food and water ad libitum.
Perfusion experiments were started after 18 hours recovery from isoflurane anesthesia.19, 20 Rats were placed into a system for freely moving animals (EICOM) that was equipped with a two‐channel swivel (TCS2‐23; ALS, Tokyo, Japan). The perfusion rate was set at 2 μL min−1 in all experiments with MRS.19, 20 Dialysates were collected every 20 minutes. Extracellular levels of l‐glutamate and GABA were measured at 8 hours after starting the perfusion. Microdialysis experiments were performed with awake and freely moving rats. To determine the effects of test agents, perfusion media was switched from MRS to MRS containing target agents. Dialysates were then injected into the UHPLC apparatus. After microdialysis experiments, brains were removed following cervical dislocation under overdose isoflurane anesthesia. Locations of dialysis probes were verified in histological examinations using 100 μm thick brain tissue slices (Vibratome 1000, Technical Products International INC, St. Louis, MO).
2.3. Microdialysis study design
Rats were randomly assigned to treatment in each experimental design. The microdialysis experiments in this study were composed of eight experimental designs. After stabilization of levels of l‐glutamate and GABA, dialysate was collected for 60 minutes as pretreatment periods of MK801 or MEM, and for 180 minutes as post‐administration periods of MK801 or MEM. The concentration of each agent was mainly prepared using a protocol from previous reports.23, 24, 25
2.3.1. Study‐1
To determine the concentration‐dependent effects of local administrations of MK801 (5 and 50 μmol L−1) and MEM (3 and 10 μmol L−1) into the mPFC on extracellular levels of glutamate and GABA in the mPFC, mPFC perfusate was switched from MRS to MRS containing MK801 or MEM (Figure 1).
Figure 1.
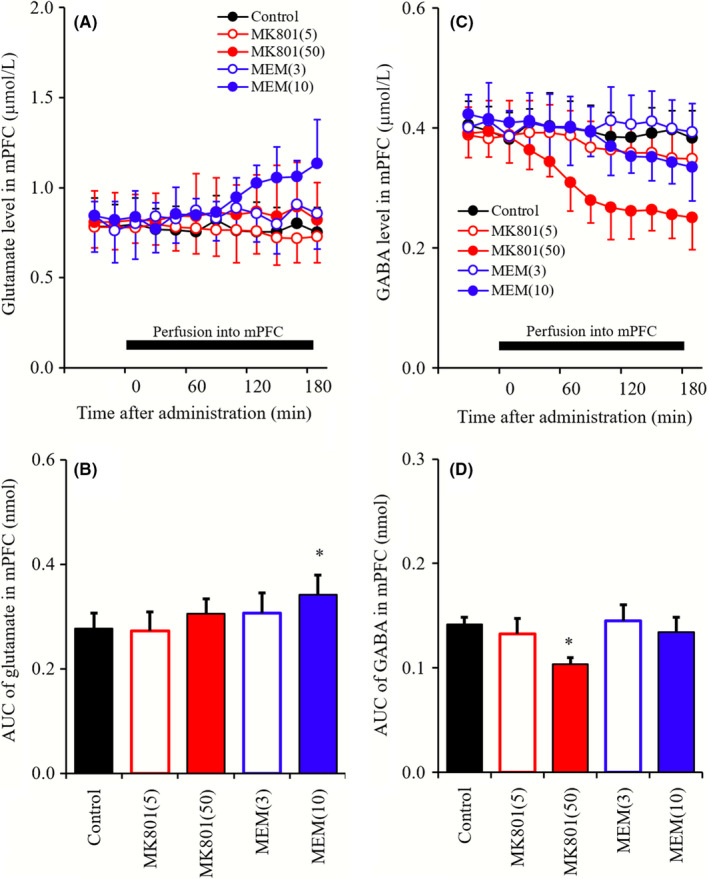
A and C, indicate comparison of concentration‐dependent effects of perfusion with MK801 (5 and 50 μmol L−1) and MEM (3 and 10 μmol L−1) into mPFC on releases of glutamate and GABA in mPFC, respectively. Black bars indicate the perfusion with MK801 and MEM into the mPFC. Microdialysis was conducted to measure the releases of l‐glutamate and GABA. In (A and C), ordinates: mean ± SD (n = 6) of extracellular levels of glutamate and GABA (μmol L−1), abscissa: time after administration of MK801 or MEM (min). B and D, indicate the AUC value of extracellular levels of glutamate and GABA (nmol) during perfusion with MK801 or MEM (from 0 to 180 minutes) of (A and C), respectively. *P < 0.05; relative to control (black) by LME with Tukey's post hoc test
2.3.2. Study‐2
To determine the concentration‐dependent effects of local administrations of MK801 (5 and 50 μmol L−1) and MEM (3 and 10 μmol L−1) into MDTN on extracellular levels of glutamate and GABA in MDTN and mPFC, MDTN perfusate was switched from MRS to MRS containing MK801 or MEM (Figure 2).
Figure 2.
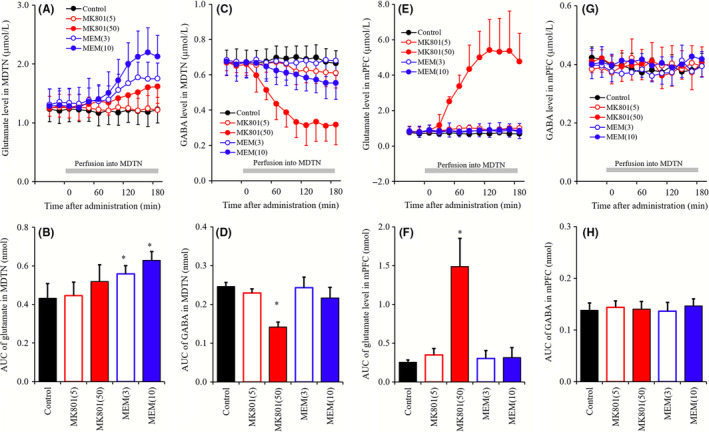
A, C, E, G, indicate comparison of concentration‐dependent effects of perfusion with MK801 (5 and 50 μmol L−1) and MEM (3 and 10 μmol L−1) into the MDTN on releases of glutamate in the MDTN, GABA in the MDTN, glutamate in the mPFC, and GABA in the mPFC, respectively. Gray bars indicate the perfusion with MK801 and MEM into the MDTN. Microdialysis was conducted to measure the releases of l‐glutamate and GABA. In (A, C, E, and G), ordinates: mean ± SD (n = 6) of extracellular levels of glutamate and GABA (μmol L−1), abscissa: time after administration of MK801 or MEM (min). (B, D, F, and H) indicate the AUC value of extracellular levels of glutamate and GABA (nmol) during perfusion with MK801 or MEM (from 0 to 180 minutes) of (A, C, E, and G), respectively. *P < 0.05; relative to control (black) by LME with Tukey's post hoc test
2.3.3. Study‐3
To clarify the mechanisms of the increase in glutamate level in mPFC (mPFC MK801‐induced glutamate rise) and the decrease in GABA level in MDTN (MDTN MK801‐induced GABA reduction) induced by perfusion with 50 μmol L−1 MK801 into MDTN, MDTN perfusate was switched from MRS containing 1 mmol L−1 NAC, 1 μmol L−1 CPG, 1 μmol L−1 LY341495, 100 μmol L−1 CPPG, or 1 μmol L−1 MUS to MRS containing the same agent with 50 μmol L−1 MK801 (Figure 3).
Figure 3.
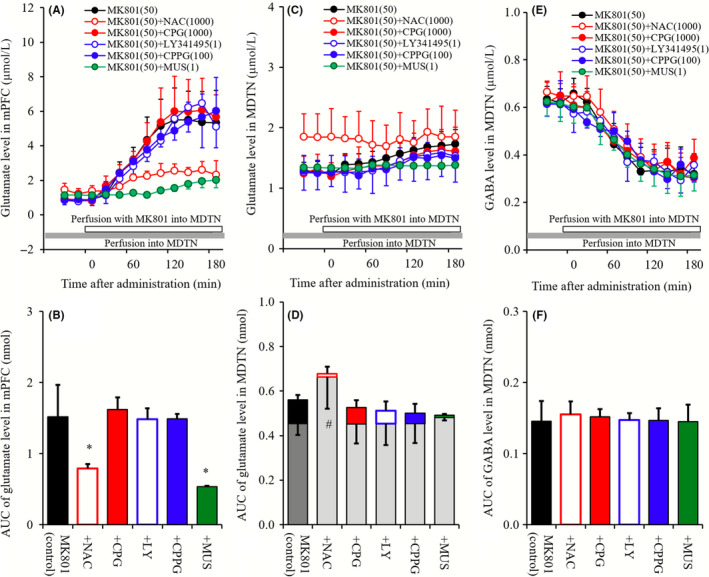
A, C, and E, indicate interaction among perfusions with NAC (1 mmol L−1), CPG (1 μmol L−1), LY341495 (1 μmol L−1), CPPG (100 μmol L−1), MUS (1 μmol L−1), and MK801 (50 μmol L−1) into the MDTN on releases of glutamate in the mPFC, glutamate in the MDTN, and GABA in the MDTN, respectively. Gray bars indicate the perfusion with NAC, CPG, LY341495, CPPG, and MUS, and open bars indicate perfusion with MK801into the MDTN. Microdialysis was conducted to measure the releases of l‐glutamate and GABA. In (A, C, and F), ordinates: mean ± SD (n = 6) of extracellular levels of glutamate and GABA (μmol L−1), abscissa: time after administration of MK801 (minutes). B, D, and F, indicate the AUC value of extracellular levels of glutamate and GABA (nmol) during perfusion with MK801 (from 0 to 180 minutes) of (A, C, and F), respectively. Especially, gray columns of (D) indicate the AUC values of basal extracellular glutamate level of (C). *P < 0.05; relative to MK801 alone (black) by LME with Tukey's post hoc test. # P < 0.05; relative to levels of MK801 pre‐perfusion of control by LME with Tukey's post hoc test
2.3.4. Study‐4
To clarify the mechanisms of mPFC MK801‐induced glutamate rise, MDTN perfusate was switched to MRS containing 50 μmol L−1 MK801, during perfusion with 1 mmol L−1 NAC, 1 μmol L−1 CPG, 1 μmol L−1 LY341495, 100 μmol L−1 CPPG, or 1 μmol L−1 MUS into the mPFC (Figure 4).
Figure 4.
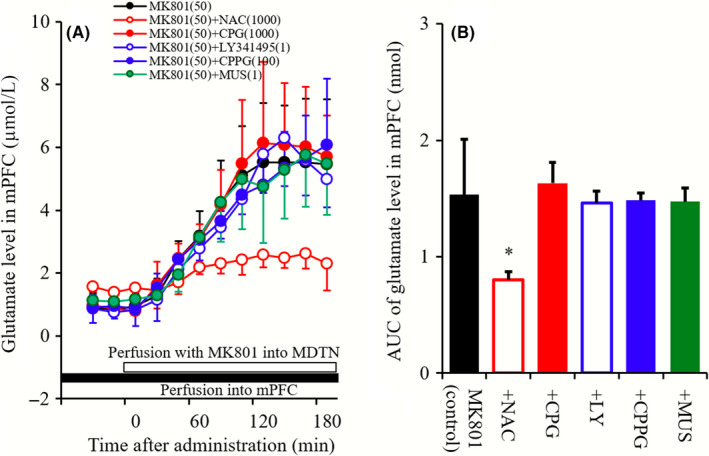
A, indicates effects of perfusions with NAC (1 m mol L−1 ), CPG (1 μmol L−1), LY341495 (1 μmol L−1), CPPG (100 μmol L−1), and MUS (1 μmol L−1) into the mPFC on mPFC MK801‐induced glutamate rise. Black bar indicates the perfusion with NAC, CPG, LY341495, CPPG, and MUS into the mPFC, and open bar indicates perfusion with MK801 into the MDTN. Microdialysis was conducted to measure the releases of l‐glutamate and GABA. In (A), ordinate: mean ± SD (n = 6) of extracellular levels of glutamate (μmol L−1), abscissa: time after administration of MK801 (minutes). B, indicates the AUC value of extracellular levels of glutamate (nmol) during perfusion with MK801 (from 0 to 180 minutes) of (A). *P < 0.05; relative to MK801 alone (black) by LME with Tukey's post hoc test
2.3.5. Study‐5
To clarify the mechanisms of the increase in glutamate level in MDTN induced by perfusion with 10 μmol L−1 MEM into MDTN (MDTN MEM‐induced glutamate rise), MDTN perfusate was switched from MRS containing 1 mmol L−1 NAC, 1 μmol L−1 CPG, 1 μmol L−1 LY341495, 100 μmol L−1 CPPG, or 1 μmol L−1 MUS to MRS containing the same agent with 10 μmol L−1 MEM (Figure 5).
Figure 5.
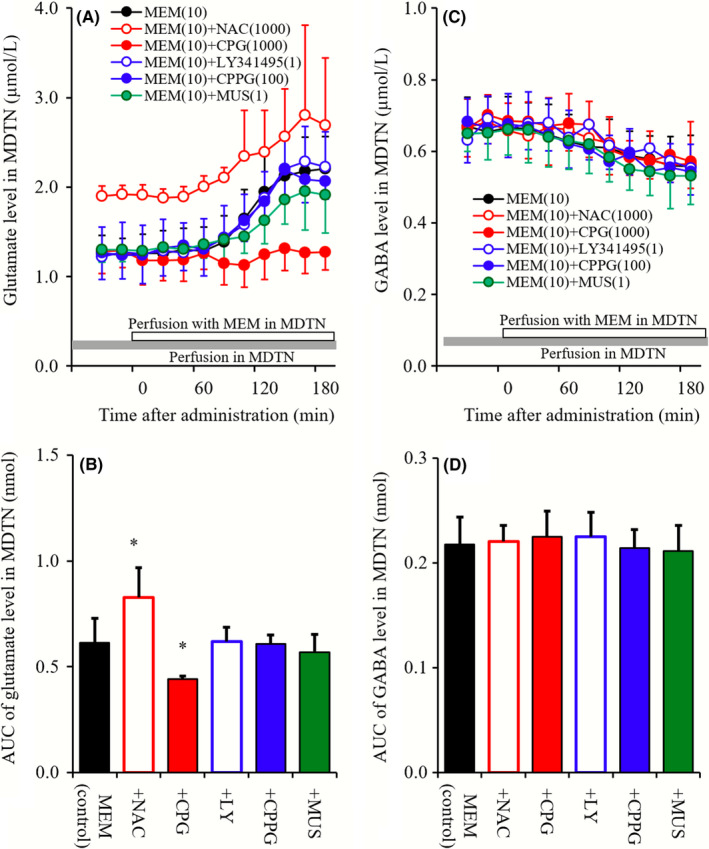
A and C, indicate interaction between perfusions with NAC (1 mmol L−1 ), CPG (1 μmol L−1), LY341495 (1 μmol L−1), CPPG (100 μmol L−1), MUS (1 μmol L−1) into MDTN, and MEM (10 μmol L−1) into the MDTN on releases of glutamate and GABA in the MDTN, respectively. Gray bars indicate the perfusion with NAC, CPG, LY341495, CPPG, and MUS, and open bars indicate perfusion with MEM into the MDTN. Microdialysis was conducted to measure the releases of l‐glutamate and GABA. In (A and C), ordinates: mean ± SD (n = 6) of extracellular levels of glutamate and GABA (μmol L−1), abscissa: time after administration of MEM (min). B and D, indicate the AUC value of extracellular levels of glutamate and GABA (nmol) during perfusion with MEM (from 0 to 180 minutes) of (A and C), respectively. *P < 0.05; relative to MEM alone (black) by LME with Tukey's post hoc test
2.3.6. Study‐6
To clarify the mechanisms of the increase in glutamate level in mPFC induced by perfusion with 10 μmol L−1 MEM into mPFC (mPFC MEM‐induced glutamate rise), mPFC perfusate was switched from MRS containing 1 mmol L−1 NAC, 1 μmol L−1 CPG, 1 μmol L−1 LY341495, 100 μmol L−1 CPPG, or 1 μmol L−1 MUS to MRS containing the same agent with 10 μmol L−1 MEM (Figure 6).
Figure 6.
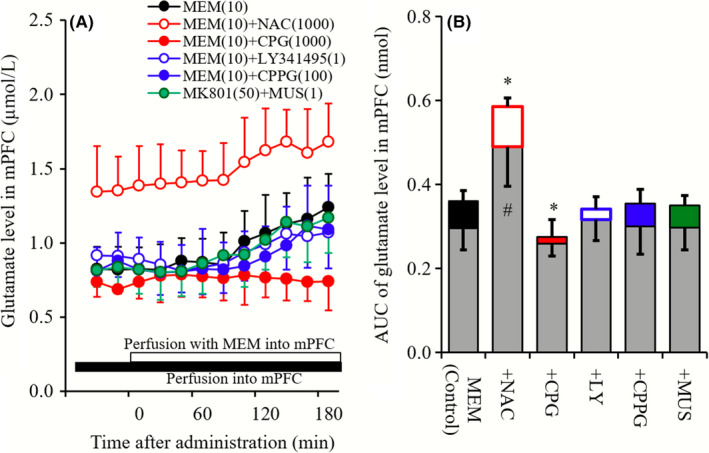
A indicates effects of perfusions with NAC (1 mmol L−1), CPG (1 μmol L−1), LY341495 (1 μmol L−1), CPPG (100 μmol L−1), and MUS (1 μmol L−1) into the mPFC on mPFC MEM‐induced glutamate rise. Black bar indicates the perfusion with NAC, CPG, LY341495, CPPG, and MUS into the mPFC, and open bar indicates perfusion with MEM (10 μmol L−1) into the mPFC. Microdialysis was conducted to measure the releases of glutamate. In (A), ordinate: mean ± SD (n = 6) of extracellular levels of glutamate (μmol L−1), abscissa: time after administration of MEM (minute). B, indicates the AUC value of extracellular levels of glutamate (nmol) during perfusion with MEM (from 0 to 180 minutes) of (A). Gray columns indicate the AUC values of basal glutamate release of (A). *P < 0.05; relative to MEM alone (black) by LME with Tukey's post hoc test. # P < 0.05; relative to levels of MEM pre‐perfusion of control by LME with Tukey's post hoc test
2.3.7. Study‐7
To determine the interaction among MEM and Sxc, II‐mGluR, and III‐mGluR in MDTN on mPFC MK801‐induced glutamate rise and MDTN MK801‐induced GABA reduction, MDTN perfusate was switched from MRS containing 10 μmol L−1 MEM, 10 μmol L−1 MEM plus 1 μmol L−1 CPG, 1 μmol L−1 LY341495, or 100 μmol L−1 CPPG to MRS containing the same agent with 50 μmol L−1 MK801 (Figure 7).
Figure 7.
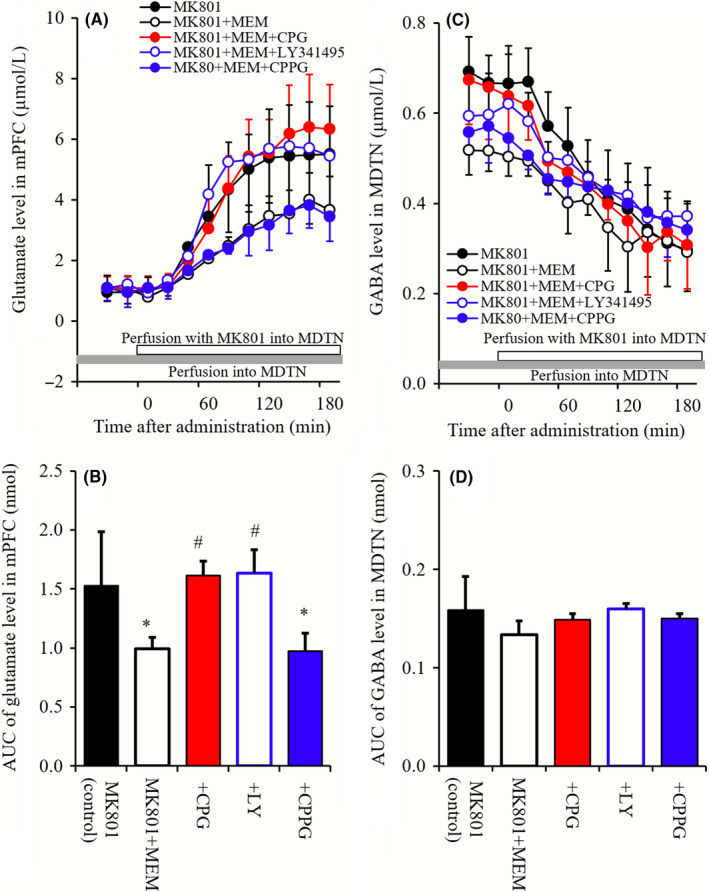
(A and B) indicate interaction between perfusion with 10 μmol L−1 MEM and 1 mmol L−1 NAC, 1 μmol L−1 CPG, 1 μmol L−1 LY341495, 100 μmol L−1 CPPG into the MDTN on mPFC MK801‐induced glutamate rise, and MDTN MK801‐induced GABA reduction, respectively. Microdialysis was conducted to measure the release of glutamate in the mPFC and GABA in the MDTN. Ordinates: mean ± SD (n = 6) of extracellular levels of l‐glutamate and GABA (μmol L−1), abscissa: time after administration of MK801 (minute). Opened bars: perfusion of 50 μmol L−1 MK801 into the MDTN. Gray bars: perfusion of 10 μmol L−1 MEM or 10 μmol L−1 MEM plus 1 mmol L−1 NAC, 1 μmol L−1 CPG, 1 μmol L−1 LY341495, and 100 μmol L−1 CPPG into the MDTN. B and D, indicate the AUC value of extracellular levels of glutamate and GABA (nmol) during perfusion with MK801 (from 0 to 180 minutes) of (A and C), respectively. *P < 0.05; relative to MK801 alone (black), and # P < 0.05; relative to MK801 plus MEM by LME with Tukey's post hoc test
2.3.8. Study‐8
To determine the interaction among MEM and Sxc, II‐mGluR, and III‐mGluR in mPFC on mPFC MK801‐induced glutamate rise, MDTN perfusate was switched from MRS to MRS containing 50 μmol L−1 MK801, during perfusion with 10 μmol L−1 MEM, 10 μmol L−1 MEM plus 1 μmol L−1 CPG, 1 μmol L−1 LY341495, or 100 μmol L−1 CPPG (Figure 8).
Figure 8.
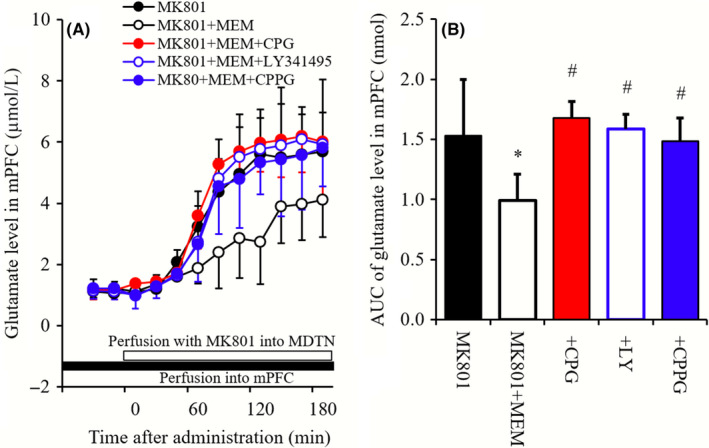
(A) indicates interaction between perfusion of 10 μmol L−1 MEM and 1 mmol L−1 NAC, 1 μmol L−1 CPG, 1 μmol L−1 LY341495, 100 μmol L−1 CPPG into the mPFC on mPFC MK801‐induced glutamate rise. Microdialysis was conducted to measure the release of glutamate in mPFC. Ordinates: mean ± SD (n = 6) of extracellular levels of l‐glutamate (μmol L−1), abscissa: time after administration of MK801 (minute). Opened bars: perfusion of 50 μmol L−1 MK801 into the MDTN. Closed bars: perfusion of 10 μmol L−1 MEM or 10 μmol L−1 MEM plus 1 mmol L−1 NAC, 1 μmol L−1 CPG, 1 μmol L−1 LY341495, and 100 μmol L−1 CPPG into the mPFC. B, indicates the AUC value of extracellular levels of glutamate (nmol) during perfusion with MK801 (from 0 to 180 minutes) of (A). *P < 0.05; relative to MK801 alone (black), and # P < 0.05; relative to MK801 plus MEM by LME with Tukey's post hoc test
2.4. Primary astrocyte culture
Astrocytes were prepared using a protocol which was adapted from previously described methods.19, 20, 26 Briefly, cortical astrocyte cultures were prepared from neonatal Sprague‐Dawley rats (SLC; n = 30) that were sacrificed by decapitation at 0‐24 hours of age and cerebral hemispheres were removed under a dissecting microscope. Tissues were then chopped into fine pieces using scissors and were triturated briefly using a micropipette. Suspensions were filtered using a 70 μm nylon mesh (BD, Franklin Lakes, NJ) and were then centrifuged. Pellets were resuspended and centrifuged three times in 10 mL Dulbecco's modified Eagle's medium containing 10% fetal calf serum (fDMEM). On day 14 of culture (DIV14), contaminating cells were removed by shaking in a standard incubator for 16 hours at 200 rpm. On DIV21, astrocytes were removed from flasks by trypsinization and were directly seeded onto translucent PET membranes (1.0 μm) in 24‐well plates (BD) at a density of 105 cells cm−2 for experiments.19, 20, 26 During DIV21‐DIV28, culture media were changed twice weekly and on DIV28, cultured astrocytes were washed three times using ACSF (wash‐out). The remaining adherent cells comprised 95% GFAP‐positive and A2B5‐negative cells, as detected using immunohistochemical staining.27
After wash‐out, astrocytes were incubated in 100 μL of ACSF per translucent PET membrane at 35°C for 60 minutes in a CO2 incubator (pretreatment). After pretreatment, astrocytes were incubated in ACSF containing MK801 (1‐30 μmol L−1), MEM (0.3‐10 μmol L−1), or cysteine (50‐400 μmol L−1) for 60 minutes and ACSF was collected for analysis.
2.5. Determination of levels of l‐glutamate, d‐serine, and GABA
l‐glutamate, d‐serine, and GABA concentrations in MRS and ACSF were determined using UHPLC (xLC3185PU, Jasco) with a fluorescence resonance energy transfer detector (xLC3120FP, Jasco) after dual derivatization with isobutyryl‐l‐cysteine and o‐phthalaldehyde. Derivative reagent solutions were prepared by dissolving isobutyryl‐l‐cysteine (2 mg) and o‐phthalaldehyde (1 mg) in 0.1 mL aliquots of ethanol and then adding 0.9 mL of sodium borate buffer (0.2 mol L−1, pH 9.0). Automated pre‐column derivatization was performed by drawing up 5 μL aliquots of sample, standard or blank solutions and 5 μL of derivatization reagent solution and holding in reaction vials for 5 min before injection. Derivatized samples (5 μL) were injected using auto sampler (xLC3059AS, Jasco). The analytical column (YMC Triat C18, particle 1.8 μm, 50 × 2.1 mm, YMC, Kyoto, Japan) was maintained at 45°C and the flow rate was set at 500 μL min−1. A linear gradient elution program was performed over 10 min with mobile phases A (0.05 mol L−1 citrate buffer, pH 5.0) and B (0.05 mol L−1 citrate buffer containing 30% acetonitrile and 30% methanol, pH 3.5). Elutes were detected fluorometrically with excitation/emission wavelengths of 280/455 nm. Where possible, sample data were randomized and blinded. In particular, in determinations of extracellular l‐glutamate, d‐serine, and GABA levels, samples were set on the auto sampler according to a table of random numbers.
2.6. Determination of diffusion rates of MEM
To accurately measure MEM concentrations in brain tissue that were perfused into MDTN and mPFC, in vivo probe diffusion was determined according to a reverse dialysis procedure.28, 29 Because solute diffusion occurs in both directions across dialysis membranes, loss of solute from the perfusate occurs at the same rate as recovery of the solute into the perfusate. During analyses, the temperature was maintained at 37°C with a perfusion warmer. The probe was set in the warmer chamber, and the MRS containing MEM was perfused into the probe for 180 minutes.
MEM levels were determined using UHPLC (PU‐4185, Jasco, Tokyo, Japan) with a mass spectrometer (Acquity SQ detector, Waters, Milford, MA). Twenty microliter aliquots of filtered samples were injected by the auto sampler and concentrations of MEM were determined using a UHPLC instrument equipped with a Triat C18 (particle 1.8 μm, 50 × 2.1 mm, YMC) column at 40°C, and the mobile phase was set at 500 μL min−1 (Acquity UPLC, Waters). A linear gradient elution program was performed over 10 minutes with mobile phases A (0.1% acetate) and B (acetonitrile). Nitrogen flows for desolvation and in the cone were set at 750 and 50 L h−1, respectively, and the desolvation temperature was set at 450°C. The cone voltage for determination of MEM (m/z = 180.3) was 40 V.
The diffusion rate for MEM was calculated as follows: (MEM concentration in pre‐perfusate − MEM concentration in post‐perfusate)/MEM concentration in pre‐perfusate. The loss of MEM from the dialysis probe (internal to external probes) was 10.8% ± 0.8%. Therefore, the estimated concentrations of MEM in extracellular spaces during perfusion with 3 and 10 μmol L−1 MEM were 0.3 and 1.1 μmol L−1, respectively.
2.7. Statistical analysis
All experiments were designed equal sizes (N = 6) per groups. The microdialysis study was compared with linear mixed effects model (LME) using SPSS for Windows (ver 25, IBM, Armonk, NY). When the F‐value of drug factor was significant, the data were analyzed by Tukey's post hoc test using BellCurve for Excel (Social Survey Research Information Co., Ltd., Tokyo, Japan). To represent the statistical significance of drug factor compared with LME and Tukey's post hoc test, the data (levels of l‐glutamate and GABA) were expressed as the area under the curve (AUC20‐180 min) values.
Concentration‐dependent effects of MK801 and MEM on Sxc activity of primary cultured astrocytes were analyzed by logistic regression analysis (BellCurve for Excel). The effects of MK801 (10 μmol L−1) and MEM (1 μmol L−1) on cysteine‐induced astroglial glutamate release were analyzed by two‐way analysis of variance followed by Tukey's post hoc tests using BellCurve for Excel.
The data and statistical analysis comply with the recommendations on experimental design and analysis in pharmacology.30
3. RESULTS
3.1. Concentration‐dependent effects of perfusion with MK801 and MEM into the mPFC on extracellular levels of glutamate and GABA in the mPFC (Study‐1)
Perfusion of MK801 (5 and 50 μmol L−1) into the mPFC did not affect glutamate levels in the mPFC, whereas MEM (3 and 10 μmol L−1) perfusions slightly but significantly increased glutamate levels in the mPFC (mPFC MEM‐induced glutamate rise; Figure 1A and B). In particular, perfusion of 3 μmol L−1 MEM into the mPFC had no effects, whereas that with 10 μmol L−1 MEM increased glutamate levels in the mPFC (Figure 1A and B). In contrast with glutamate, perfusions of MK801 into the mPFC concentration‐dependently decreased extracellular GABA levels in the mPFC (mPFC MK801‐induced GABA reduction), whereas perfusion with MEM had no effects (Figure 1C and D).
3.2. Concentration‐dependent effects of perfusion with MK801 and MEM into the MDTN on extracellular levels of glutamate and GABA in the MDTN and mPFC
Perfusion with MK801 (5 and 50 μmol L−1) into the MDTN did not affect glutamate levels in the MDTN (Figure 2A and B), whereas MEM (3 or 10 μmol L−1) perfusions concentration‐dependently increased glutamate levels (MDTN MEM‐induced glutamate rise; Figure 2A and B). In contrast with glutamate, the extracellular GABA level in MDTN was concentration‐dependently decreased by perfusion with MK801 into MDTN (MDTN MK801‐induced GABA reduction; Figure 2C and D), but was unaffected by perfusion with MEM into MDTN (Figure 2C and D). Although GABA levels were unaffected by 5 μmol L−1 MK801, 50 μmol L−1 MK801 decreased GABA levels significantly (P < 0.05; Figure 2C and D).
Perfusion with MK801 (5 and 50 μmol L−1) into the MDTN concentration‐dependently increased extracellular glutamate level in the mPFC (mPFC MK801‐induced glutamate rise; Figure 2C and D), whereas perfusion with MEM (3 or 10 μmol L−1) into MDTN had no effects (Figure 2E and F). Again, although MK801 was ineffective at 5 μmol L−1, 50 μmol L−1 MK801 increased glutamate levels significantly (P < 0.05; Figure 2C and D). In contrast with glutamate, perfusions of MK801 or MEM did not affect extracellular GABA level in the mPFC (Figure 2G and H).
3.3. Roles of Sxc, II‐mGluR, III‐mGluR, and GABAA receptor in the MDTN on mPFC MK801‐induced glutamate rise and MDTN MK801‐induced GABA reduction
Perfusion with MK801 into MDTN increased the extracellular glutamate level in the mPFC (mPFC MK801‐induced glutamate rise), and these were reduced by perfusions with 1 mmol L−1 NAC (cysteine prodrug) and 1 μmol L−1 MUS (GABAA receptor agonist) into the MDTN, whereas neither CPG (1 μmol L−1; Sxc inhibitor), LY341495 (1 μmol L−1; II‐mGluR antagonist) nor CPPG (100 μmol L−1; III‐mGluR antagonist) affected mPFC MK801‐induced glutamate rise (Figure 3A and B).
Neither perfusions with MK801 (50 μmol L−1), CPG (1 μmol L−1), LY341495 (1 μmol L−1), CPPG (100 μmol L−1) nor MUS (1 μmol L−1) into the MDTN affected glutamate levels in the MDTN, whereas perfusion with NAC (1 mmol L−1) into the MDTN increased basal glutamate levels in the MDTN (P < 0.05; Figure 3C and D).
Perfusion with MK801 into MDTN decreased the extracellular GABA level in the MDTN (MDTN MK801‐induced GABA reduction), and these were not affected by perfusions with NAC (1 mmol L−1), CPG (1 μmol L−1), LY341495 (1 μmol L−1), CPPG (100 μmol L−1), or NAC (1 μmol L−1) into the MDTN (Figure 3E and F).
3.4. Effects of Sxc, II‐mGluR, III‐mGluR, and GABAA receptor in the mPFC on mPFC MK801‐induced glutamate rise
The extracellular glutamate level was induced by perfusion with 50 μmol L−1 MK801 into MDTN (mPFC MK801‐induced glutamate rise). mPFC MK801‐induced glutamate rise was reduced by perfusion with NAC (1 mmol L−1) into mPFC, whereas neither perfusion with CPG (1 μmol L−1), LY341495 (1 μmol L−1), CPPG (100 μmol L−1) nor MUS (1 μmol L−1) into mPFC affected mPFC MK801‐induced glutamate rise (Figure 4A and B).
3.5. Effects of Sxc, II‐mGluR, III‐mGluR, and GABAA receptor in the MDTN on MEM‐induced changes in glutamate and GABA releases in the MDTN
Neither perfusion with LY341495 (1 μmol L−1), CPPG (100 μmol L−1) nor MUS (1 μmol L−1) into MDTN affected MDTN MEM‐induced glutamate rise, whereas perfusion with NAC (1 mmol L−1) and CPG (1 μmol L−1) increased and decreased MDTN MEM‐induced glutamate rise, respectively (Figure 5A and B). Contrary to glutamate, neither perfusion with MEM, NAC, CPG, LY341495, CPPG, or MUS into MDTN affected GABA level in MDTN (Figure 5C and D).
3.6. Effects of Sxc, II‐mGluR, III‐mGluR, and GABAA receptor in the mPFC on mPFC MEM‐induced glutamate rise
Perfusion with NAC (1 mmol L−1) into mPFC increased extracellular glutamate level in mPFC, whereas neither perfusion with CPG (1 μmol L−1), LY341495 (1 μmol L−1), CPPG (100 μmol L−1) nor MUS (1 μmol L−1) into mPFC affected glutamate level in mPFC (Figure 6A and B). Neither perfusion with LY341495 (1 μmol L−1), CPPG (100 μmol L−1) nor MUS (1 μmol L−1) into mPFC affected mPFC MEM‐induced glutamate rise, whereas perfusion with NAC (1 mmol L−1) and CPG (1 μmol L−1) increased and decreased mPFC MEM‐induced glutamate rise, respectively (Figure 6A and B).
3.7. Interaction between perfusion with MEM and inhibitors of Sxc, II‐mGluR, and III‐mGluR into the MDTN on mPFC MK801‐induced glutamate rise and MDTN MK801‐induced GABA reduction
Perfusion with MEM (10 μmol L−1) into MDTN reduced mPFC MK801‐induced glutamate rise (Figure 7A and B). Both perfusions with CPG (1 μmol L−1) and LY341495 (1 μmol L−1) prevented the inhibitory effect of MEM on mPFC MK801‐induced glutamate rise, whereas perfusion with CPPG (100 μmol L−1) into MDTN did not affect (Figure 7A and B). MDTN MK801‐induced GABA reduction was not affected by perfusion with MEM, CPG, LY341495, or CPPG into the MDTN (Figure 7C and D).
3.8. Interaction between perfusion with MEM and inhibitors of Sxc, II‐mGluR, and III‐mGluR into mPFC on mPFC MK801‐induced glutamate rise
Perfusion with MEM (10 μmol L−1) into the mPFC reduced mPFC MK801‐induced glutamate rise (Figure 8A and B). Perfusions with CPG (1 μmol L−1), LY341495 (1 μmol L−1), and CPPG (100 μmol L−1) prevented the inhibitory effect of MEM on mPFC MK801‐induced glutamate rise (Figure 8A and B).
3.9. Sxc activity assay using primary cultured astrocytes
Cysteine concentration‐dependently increased glutamate release from primary cultured astrocytes but did not affect d‐serine release (Figure 9A). MEM (1 μmol L−1) enhanced cysteine‐induced glutamate release from primary cultured astrocytes (Sxc activity), whereas MK801(10 μmol L−1) did not affect Sxc activity (Figure 9A). Moreover, Sxc activity (100 μmol L−1 cysteine‐induced astroglial glutamate release) was concentration‐dependently enhanced by MEM (0.3‐10 μmol L−1), but no effects of MK801 were observed under these conditions (Figure 9B).
Figure 9.
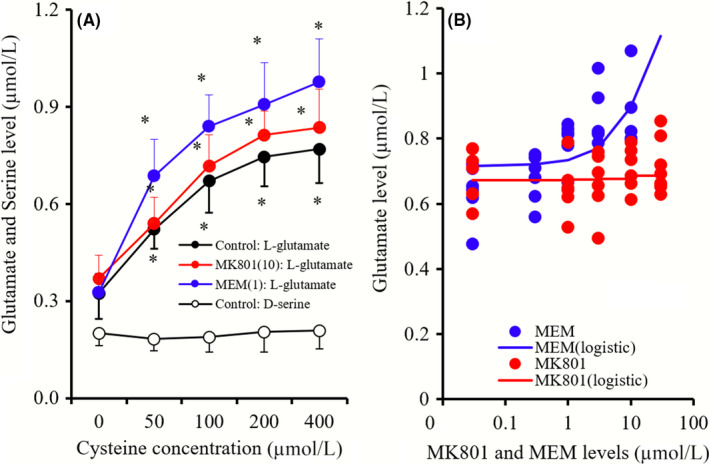
A, indicates the concentration‐dependent effects of cysteine (0‐400 μmol L−1) on releases of glutamate and d‐serine, and the effects of MK801 (10 μmol L−1) and MEM (1 μmol L−1) on concentration‐dependent effects of cysteine on glutamate release from primary cultured astrocytes. Ordinate in (A): mean ± SD (n = 6) of extracellular levels of l‐glutamate and d‐serine (μmol L−1), abscissa: concentration of cysteine. *P < 0.05; relative to MK801 free or MEM free by LME with Tukey's post hoc test. B, indicates concentration‐dependent effects of MK801 (1‐30 μmol L−1) and MEM (0.3‐10 μmol L−1) on 100 μmol L−1 cysteine‐induced glutamate release from primary cultured astrocytes (Sxc activity). Ordinate in (B): mean ± SD (n = 6) of extracellular levels of l‐glutamate (μmol L−1), abscissa: concentration of MK801 or MEM (μmol L−1). 100 μmol L−1 cysteine‐induced astroglial glutamate release was concentration‐dependently enhanced by MEM (Logistic regression)
4. DISCUSSION AND CONCLUSIONS
4.1. Effects of MK801 on thalamocortical glutamatergic transmission
Several microdialysis studies show that systemic administration of the noncompetitive NMDAR antagonists phencyclidine, ketamine, and MK801 increased glutamate release in the mPFC.23, 31, 32, 33 However, local administration of MK801 into the mPFC did not affect glutamate levels in the mPFC.19, 23, 29, 34, 35, 36 In contrast with observations in the mPFC, inhibition of NMDAR in the MDTN induced by local administration of MK801 into the MDTN increased glutamate release in the mPFC (mPFC MK801‐induced glutamate rise).23 The present study showed that perfusion of MK801 into the MDTN also increased glutamate release from the mPFC without affecting that in the MDTN. These results suggest that the major mechanisms of systemic NMDAR antagonist‐induced glutamate release in the mPFC are generated by enhanced thalamocortical glutamatergic transmission outside of the mPFC.23
Glutamatergic neurons in the MDTN, which receive GABAergic terminals from the reticular thalamic nucleus (RTN) and other MDTN regions, project to superficial layers in the frontal cortex.37, 38, 39 Moreover, thalamocortical glutamatergic terminals activate catecholaminergic terminals, but do not make contact with cortical GABAergic neurons.35, 36 However, a large proportion of the GABAergic neurons in the frontal cortex are regulated by excitatory glutamatergic transmission from other cortical regions via activation of NMDAR.23, 35, 40, 41 Given these anatomical observations, we characterized the mechanisms of systemic MK801‐induced glutamate release in the mPFC by determining the effects of MK801 perfusions into the MDTM and the mPFC on GABA release from both regions. The resulting data do not contradict our hypothesis that perfusion with MK801 into the MDTN and the mPFC decreases GABA levels in the MDTN (MDTN MK801‐induced GABA reduction) and the mPFC, respectively. Furthermore, mPFC MK801‐induced glutamate rise was inhibited by perfusions with MUS (GABAA receptor agonist) into the MDTN, but were not affected by perfusions of MUS into the mPFC. Therefore, the present data indicate that the induction of glutamate release by systemic MK801 administration follows activation of the thalamocortical glutamatergic pathway via thalamic GABAergic disinhibition by NMDAR antagonism in the MDTN.
The IC50 of MK801 for NMDAR ranges from 5 to 50 nmol L−1.42 Differences in effective concentrations (IC50 values) of MK801 between in vitro and in vivo microdialysis experiments suggest that the generator region of MK801‐induced glutamate release in the mPFC includes the MDTN and other thalamic regions around the MDTN, such as the RTN. In further studies, we will determine the effects of local MK801 treatments of the RTN on thalamocortical (from MDTN to frontal cortex) glutamatergic transmission.
Herein, we also identified GABA‐independent regulatory mechanisms of thalamocortical (from MDTN to mPFC) glutamatergic transmission. Recent experiments show MK801‐induced glutamate increases in the mPFC induced by perfusion with NAC into the MDTN and the mPFC through activation of II‐GluR in the MDTN and II‐mGluR/III‐mGluR in the mPFC 23 (Figure 10). Although perfusion of the cysteine prodrug NAC into the MDTN increased extracellular glutamate levels without affecting GABA release in the MDTN, mPFC MK801‐induced glutamate rise was inhibited by perfusion of NAC into the MDTN and the mPFC. In contrast, perfusions of CPG (Sxc inhibitor), LY341495 (II‐mGluR antagonist), and CPPG (III‐mGluR antagonist) into the MDTN and the mPFC did not affect mPFC MK801‐induced glutamate rise. Taken together with our previous data,23 the present observations of astroglial glutamate release from Sxc indicate phasic attenuation of thalamocortical glutamatergic transmission in the MDTN and the mPFC.
Figure 10.
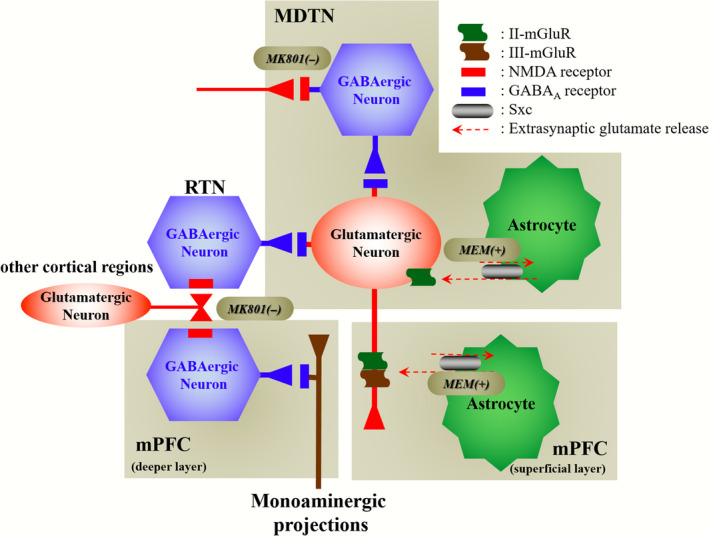
Our proposed hypothesis for the extended neural circuitry involved in thalamocortical (from MDTN to mPFC) glutamatergic transmission. MK801 inhibits tonically active NMDAR (red squares) on GABAergic neurons (blue hexagon) in MDTN and probably RTN, which project to MDTN glutamatergic neurons (red circle). Inhibition of NMDAR in GABAergic neurons leads to disinhibition of MDTN glutamatergic neurons. The GABAergic disinhibition activates MDTN glutamatergic neuronal activity resulting in an increase in glutamate release in the mPFC. II‐mGluRs (green wave) in both the MDTN and mPFC are activated by glial‐released l‐glutamate through astroglial Sxc (gray ellipse). Activation of extra‐synaptic II‐mGluRs in the MDTN and mPFC results in the inhibition of MDTN glutamatergic projection. Activated III‐mGluR (blown wave) in the mPFC presynaptically inhibits the activity of MDTN glutamatergic projection. MEM activates Sxc in the MDTN and mPFC. The stimulatory effects of MEM on Sxc attenuate the hyperactivation of thalamocortical glutamatergic transmission induced by MK801
4.2. Effects of MEM on thalamocortical glutamatergic transmission
Levels of MEM in the CNS are similar to those in plasma,43 and the therapeutically relevant plasma concentration of MEM is considered to be around 1 μmol L−1.9, 44 Several preclinical studies suggest that the affinity of MEM is at or below the very low μmol L−1 range, warranting consideration as a potential therapeutic target. MEM also inhibited NMDAR in previous studies, with IC50 values of 0.3 to 0.9 μmol L−1.45 Therefore, perfusions with 3 and 10 μmol L−1 MEM, according to estimated extracellular and intracellular MEM concentrations of 0.3 and 1.1 μmol L−1, respectively, were around the IC50 value for NMDAR and were within the therapeutic range.
In this study, perfusion with MEM into the mPFC and the MDTN increased glutamate release without affecting GABA release in the same regions, resembling the effects of NAC. Additionally, perfusion with MEM into the MDTN did not affect levels of glutamate or GABA in the mPFC, strongly indicating that the effects of therapeutically relevant concentrations of MEM on thalamocortical glutamatergic transmission are modulated by diverse mechanisms of NMDAR, rather than by Sxc‐associated mechanisms. Accordingly, in vitro studies using primary cultured astrocytes demonstrated that MEM activates astroglial Sxc, with concentration‐dependent increases in cysteine‐induced astroglial glutamate release from primary cultured astrocytes.
Both MDTN MEM‐induced glutamate rise (increased MDTN glutamate level by perfusion with MEM into MDTN) and mPFC MEM‐induced glutamate rise (increased mPFC glutamate level by perfusion with MEM into mPFC) were inhibited and enhanced by perfusions with CPG (Sxc inhibitor) and NAC (Sxc activator), respectively, but were not affected by LY341495 (II‐mGluR antagonist), CPPG (III‐mGluR antagonist), or MUS (GABAA receptor agonist). These results also support pharmacological data showing that MEM directly enhances Sxc activity in the MDTN and the mPFC, resulting in increases in extra‐synaptic glutamate release.
Perfusions with MEM into the MDTN inhibited mPFC MK801‐induced glutamate rise without affecting MDTN MK801‐induced GABA reduction, similar to the effects of NAC. In the MDTN, the inhibitory effects of MEM perfusions into the MDTN on mPFC MK801‐induced glutamate rise were inhibited by perfusions with CPG and LY341495, but were not by perfusion with CPPG into the MDTN. However, in the mPFC, the inhibitory effects of MEM perfusions into mPFC on mPFC MK801‐induced glutamate rise were antagonized by CPG, LY341495, and CPPG. Hence, MEM may enhance Sxc activities in the MDTN and the mPFC, although the inhibitory mechanisms of MEM differ between these brain regions.23 Specifically, exported glutamate release from astroglial Sxc in the MDTN and the mPFC enhances respective somato‐dendritic II‐mGluR in the MDTN46 and presynaptic II‐mGluR and III‐mGluR.23 II‐mGluR, which includes mGlu2R and mGlu3R, is widely expressed in brain tissues and inhibits the release of neurotransmitters.47 Although mGlu3R is expressed in pre‐ and postsynaptic astroglial regions, mGlu2R is localized in the extra‐synaptically axonal presynaptic terminal region.47 III‐mGluR, which includes mGlu4R, mGlu7R, and mGlu8R, is mainly expressed in excitatory presynaptic synapses, and mGlu6R is primarily expressed in the retina.47 Activation of mGlu7R and mGluR8R suppresses thalamocortical transmission.48 Therefore, the thalamocortical glutamatergic pathway receives two independent extra‐synaptically inhibitory regulation mechanisms, and these are associated with Sxc/mGluR in the MDTN (Sxc/II‐mGluR) and the mPFC (Sxc/II‐mGluR/III‐mGluR).
4.3. Candidate mechanisms of MEM
Systemic administration of the noncompetitive NMDAR antagonists phencyclidine,31 ketamine,33 and MK80132 increases glutamate release in the mPFC. In contrast with the conditions of systemic administration, local administrations with the noncompetitive NMDAR antagonists MK80119, 32, 35, 36, 49, 50 and ketamine33 into the mPFC did not affect mPFC glutamate release. However, local administration of the competitive NMDAR antagonist 3‐(2‐carboxypiperazin‐4‐yl)‐propyl‐1‐phosphonic‐acid into the mPFC increased glutamate release in the mPFC.51 The present study fails to indicate the mechanisms behind discrepancies between the effects of perfusions with competitive and noncompetitive NMDAR antagonists into the mPFC on glutamate release in the mPFC. NMDAR forms hetero‐tetrameric complexes comprising two obligatory NR1 and NR2 subunits that include the proteins NR2A, NR2B, NR2C, and NR2D.52 The agents 3‐(2‐carboxypiperazin‐4‐yl)‐propyl‐1‐phosphonic‐acid, phencyclidine, ketamine, and MK801 have affinity for NR2A, NR2B, NR2C, and NR2D subunits. 3‐(2‐carboxypiperazin‐4‐yl)‐propyl‐1‐phosphonic‐acid has higher affinity for NR2B than for the other NR2 subunits, whereas phencyclidine, ketamine, and MK801 have higher affinity for NR2C than for other NR2 subunits.52 A previous behavior study demonstrated that phencyclidine and MK801 fully emulate the discriminative stimulatory effects of ketamine, but neither 3‐(2‐carboxypiperazin‐4‐yl)‐propyl‐1‐phosphonic‐acid nor ifenprodil, which is a NR2B‐containing NMDAR antagonist, have similar activities to that of ketamine.53 Considered with the studies described above, inhibition of NR2B containing NMDAR in the mPFC may enhance glutamate release from the mPFC, but may not play important roles in phencyclidine‐induced psychosis. We show herein that perfusion with MK801 into the MDTN, but not into the mPFC, concentration‐dependently increases glutamate release in the mPFC, suggesting that the MDTN is a primary site for the actions of NMDAR antagonists that contribute to the diverse symptoms of schizophrenia.
Traditionally, NMDAR agonists and antagonists were thought to contribute to cognitive impairments. In rodent models, surgical and neurotoxic MDTN lesion studies emphasize the roles of MDTN in cognitive deficits. Several other studies also show that MDTN lesions from microinjections of NMDA disrupted cognitive components.54, 55 Although we failed to decipher the contradictive mechanisms between cognitive dysfunctions of NMDAR agonists and antagonists, opposing actions of MK801 (cognitive impairment inducer) and MEM (cognitive improvement inducer) on thalamocortical glutamatergic transmission suggest that hyperactivation of thalamocortical glutamatergic transmission by NMDAR antagonists causes the release of toxic extracellular glutamate levels in the mPFC,35, 36 and thus hyperactivated AMPA/glutamate receptors may disrupt the thalamocortical glutamatergic pathway. We suggest that protective actions of MEM are mediated by inhibition of NMDAR and activation of Sxc and play important roles in the positive cognitive effects of MEM.
Sxc exchanges extracellular cystine and intracellular glutamate across plasma membranes, and mediates a wide range CNS functions.12 The import of cystine through Sxc produces glutathione as a precursor,12 and exported glutamate plays important roles in extra‐synaptic transmission.23, 46 Several clinical studies show that NAC ameliorates cognitive dysfunctions in patients with early stage Alzheimer's disease,56 severe schizophrenia, and bipolar disorder.57 Preclinical studies also demonstrate that behavioral deficits in rat phencyclidine models are addressed by NAC treatments.31 The present experiments indicate dual actions of MEM in the MDTN, with weak inhibition of NMDAR activity and enhancement of Sxc activity (exported glutamate release) leading to activation of inhibitory II‐mGluR. In terms of the effects of MEM on thalamocortical glutamatergic transmission, activation of Sxc/II‐mGluR in the MDTN was more predominant than NMDAR/GABAergic disinhibition. Thus, MEM inhibited MK801‐induced glutamate increases in the mPFC. Additionally, Sxc‐exported glutamate release was induced by MEM and inhibited mPFC MK801‐induced increases in glutamate levels by activating II‐mGluR and III‐mGluR. Therefore, the present study suggests that stimulatory effects of MEM on astroglial Sxc contribute to neuroprotective actions and the positive effects of MEM on cognition.
5. CONCLUSIONS AND IMPLICATIONS
The present study demonstrates dual independent regulatory mechanisms of thalamocortical glutamatergic transmission. In particular, inhibition of NMDAR in the MDTN activated thalamocortical glutamatergic transmission via disinhibiting GABAergic signaling in the MDTN. In contrast with NMDAR, exported glutamate release from astroglial Sxc activates inhibitory II‐mGluR in the MDTN, and II‐mGluR and III‐mGluR in the mPFC. Therapeutically relevant concentrations of MEM cannot prevent inhibition of GABAergic signaling, but stimulatory effects of MEM on Sxc activity abolished hyperactivated thalamocortical glutamatergic transmission following disinhibition by NMDAR/GABAergic pathways. Therapeutically relevant concentration of MEM activates Sxc more than they inhibit NMDAR. Yet the combination of MEM actions, with reduced NMDAR and activated Sxc activities, contributes to the neuroprotective effects of MEM. Furthermore, predominantly activated Sxc likely compensates for the cognitive impairments that are induced by hyperactivation of thalamocortical glutamatergic transmission, following activation of functional complexes, Sxc/II‐mGluR in MDTN and Sxc/II‐mGluR/III‐mGluR in mPFC.
AUTHOR CONTRIBUTIONS
MO designed the research. KF and MO performed experiments. YK, TS, and YU collected manuscript and assembled data. All authors have given their final approval for the manuscript.
CONFLICT OF INTEREST
The authors state no conflict of interest.
ACKNOWLEDGEMENTS
This study was supported by Japan Society for the Promotion of Science (15H04892) and Japan Agency for Medical Research and development, AMED (JP17ek0109120).
Okada M, Fukuyama K, Kawano Y, Shiroyama T, Ueda Y. Memantine protects thalamocortical hyper‐glutamatergic transmission induced by NMDA receptor antagonism via activation of system xc− . Pharmacol Res Perspect. 2019;e00457. 10.1002/prp2.457
REFERENCES
- 1. Lieberman JA, Bymaster FP, Meltzer HY, et al. Antipsychotic drugs: comparison in animal models of efficacy, neurotransmitter regulation, and neuroprotection. Pharmacol Rev. 2008;60:358‐403. [DOI] [PMC free article] [PubMed] [Google Scholar]
- 2. Malhotra AK, Pinals DA, Adler CM, et al. Ketamine‐induced exacerbation of psychotic symptoms and cognitive impairment in neuroleptic‐free schizophrenics. Neuropsychopharmacology. 1997;17:141‐150. [DOI] [PubMed] [Google Scholar]
- 3. Krystal JH, D'Souza DC, Mathalon D, Perry E, Belger A, Hoffman R. NMDA receptor antagonist effects, cortical glutamatergic function, and schizophrenia: toward a paradigm shift in medication development. Psychopharmacology. 2003;169:215‐233. [DOI] [PubMed] [Google Scholar]
- 4. Singh SP, Singh V. Meta‐analysis of the efficacy of adjunctive NMDA receptor modulators in chronic schizophrenia. CNS Drugs. 2011;25:859‐885. [DOI] [PubMed] [Google Scholar]
- 5. Kishi T, Iwata N. NMDA receptor antagonists interventions in schizophrenia: meta‐analysis of randomized, placebo‐controlled trials. J Psychiatr Res. 2013;47:1143‐1149. [DOI] [PubMed] [Google Scholar]
- 6. de Lucena D, Fernandes BS, Berk M, et al. Improvement of negative and positive symptoms in treatment‐refractory schizophrenia: a double‐blind, randomized, placebo‐controlled trial with memantine as add‐on therapy to clozapine. J Clin Psychiatry. 2009;70:1416‐1423. [DOI] [PubMed] [Google Scholar]
- 7. Rezaei F, Mohammad‐Karimi M, Seddighi S, et al. Memantine add‐on to risperidone for treatment of negative symptoms in patients with stable schizophrenia: randomized, double‐blind, placebo‐controlled study. J Clin Psychopharmacol. 2013;33:336‐342. [DOI] [PubMed] [Google Scholar]
- 8. Sani G, Serra G, Kotzalidis GD, et al. The role of memantine in the treatment of psychiatric disorders other than the dementias: a review of current preclinical and clinical evidence. CNS Drugs. 2012;26:663‐690. [DOI] [PubMed] [Google Scholar]
- 9. Parsons CG, Stoffler A, Danysz W. Memantine: a NMDA receptor antagonist that improves memory by restoration of homeostasis in the glutamatergic system–too little activation is bad, too much is even worse. Neuropharmacology. 2007;53:699‐723. [DOI] [PubMed] [Google Scholar]
- 10. Onogi H, Ishigaki S, Nakagawasai O, et al. Influence of memantine on brain monoaminergic neurotransmission parameters in mice: neurochemical and behavioral study. Biol Pharm Bull. 2009;32:850‐855. [DOI] [PubMed] [Google Scholar]
- 11. Liu W, Xu Z, Deng Y, Xu B, Wei Y, Yang T. Protective effects of memantine against methylmercury‐induced glutamate dyshomeostasis and oxidative stress in rat cerebral cortex. Neurotox Res. 2013;24:320‐337. [DOI] [PubMed] [Google Scholar]
- 12. Lewerenz J, Hewett SJ, Huang Y, et al. The cystine/glutamate antiporter system x(c)(‐) in health and disease: from molecular mechanisms to novel therapeutic opportunities. Antioxid Redox Signal. 2013;18:522‐555. [DOI] [PMC free article] [PubMed] [Google Scholar]
- 13. Kafi H, Salamzadeh J, Beladimoghadam N, Sistanizad M, Kouchek M. Study of the neuroprotective effects of memantine in patients with mild to moderate ischemic stroke. Iran J Pharm Res. 2014;13:591‐598. [PMC free article] [PubMed] [Google Scholar]
- 14. McClatchy DB, Savas JN, Martínez‐Bartolomé S, et al. Global quantitative analysis of phosphorylation underlying phencyclidine signaling and sensorimotor gating in the prefrontal cortex. Mol Psychiatry. 2016;21:205. [DOI] [PMC free article] [PubMed] [Google Scholar]
- 15. Alexander SP, Peters JA, Kelly E, et al. The concise guide to pharmacology 2017/18: ligand‐gated ion channels. Br J Pharmacol. 2017;174(Suppl 1):S130‐S159. [DOI] [PMC free article] [PubMed] [Google Scholar]
- 16. Alexander SP, Kelly E, Marrion NV, et al. The concise guide to PHARMACOLOGY 2017/18: transporters. Br J Pharmacol. 2017;174(Suppl 1):S360‐S446. [DOI] [PMC free article] [PubMed] [Google Scholar]
- 17. Alexander SP, Christopoulos A, Davenport AP, et al. The concise guide to PHARMACOLOGY 2017/18: G protein‐coupled receptors. Br J Pharmacol. 2017;174(Suppl 1):S17‐S129. [DOI] [PMC free article] [PubMed] [Google Scholar]
- 18. Patel SA, Warren BA, Rhoderick JF, Bridges RJ. Differentiation of substrate and non‐substrate inhibitors of transport system xc(‐): an obligate exchanger of L‐glutamate and L‐cystine. Neuropharmacology. 2004;46:273‐284. [DOI] [PubMed] [Google Scholar]
- 19. Tanahashi S, Yamamura S, Nakagawa M, Motomura E, Okada M. Clozapine, but not haloperidol, enhances glial d‐serine and L‐glutamate release in rat frontal cortex and primary cultured astrocytes. Br J Pharmacol. 2012;165:1543‐1555. [DOI] [PMC free article] [PubMed] [Google Scholar]
- 20. Yamamura S, Hoshikawa M, Dai K, et al. ONO‐2506 inhibits spike‐wave discharges in a genetic animal model without affecting traditional convulsive tests via gliotransmission regulation. Br J Pharmacol. 2013;168:1088‐1100. [DOI] [PMC free article] [PubMed] [Google Scholar]
- 21. McGrath JC, Lilley E. Implementing guidelines on reporting research using animals (ARRIVE etc.): new requirements for publication in BJP. Br J Pharmacol. 2015;172:3189‐3193. [DOI] [PMC free article] [PubMed] [Google Scholar]
- 22. Paxinos G, Watson C. The Rat Brain: In Stereotoxic Coordinates, 6th edn. Academic Press: San Dieg; 2007. [Google Scholar]
- 23. Fukuyama K, Hasegawa T, Okada M. Cystine/Glutamate antiporter and aripiprazole compensate NMDA antagonist‐induced dysfunction of thalamocortical L‐glutamatergic transmission. Int J Mol Sci. 2018;19:3645. [DOI] [PMC free article] [PubMed] [Google Scholar]
- 24. Kau KS, Madayag A, Mantsch JR, Grier MD, Abdulhameed O, Baker DA. Blunted cystine‐glutamate antiporter function in the nucleus accumbens promotes cocaine‐induced drug seeking. Neuroscience. 2008;155:530‐537. [DOI] [PMC free article] [PubMed] [Google Scholar]
- 25. Xi ZX, Shen H, Baker DA, Kalivas PW. Inhibition of non‐vesicular glutamate release by group III metabotropic glutamate receptors in the nucleus accumbens. J Neurochem. 2003;87:1204‐1212. [DOI] [PubMed] [Google Scholar]
- 26. Fukuyama K, Tanahashi S, Hoshikawa M, Shinagawa R, Okada M. Zonisamide regulates basal ganglia transmission via astroglial kynurenine pathway. Neuropharmacology. 2014;76(Pt A):137‐145. [DOI] [PubMed] [Google Scholar]
- 27. Tateishi N, Shimoda T, Manako J, Katsumata S, Shinagawa R, Ohno H. Relevance of astrocytic activation to reductions of astrocytic GABAA receptors. Brain Res. 2006;1089:79‐91. [DOI] [PubMed] [Google Scholar]
- 28. Le Quellec A, Dupin S, Genissel P, Saivin S, Marchand B, Houin G. Microdialysis probes calibration: gradient and tissue dependent changes in no net flux and reverse dialysis methods. J Pharmacol Toxicol Methods. 1995;33:11‐16. [DOI] [PubMed] [Google Scholar]
- 29. Tanahashi S, Yamamura S, Nakagawa M, Motomura E, Okada M. Dopamine D2 and serotonin 5‐HT1A receptors mediate the actions of aripiprazole in mesocortical and mesoaccumbens transmission. Neuropharmacology. 2012;62:765‐774. [DOI] [PubMed] [Google Scholar]
- 30. Curtis MJ, Alexander S, Cirino G, et al. Experimental design and analysis and their reporting II: updated and simplified guidance for authors and peer reviewers. Br J Pharmacol. 2018;175:987‐993. [DOI] [PMC free article] [PubMed] [Google Scholar]
- 31. Baker DA, Madayag A, Kristiansen LV, Meador‐Woodruff JH, Haroutunian V, Raju I. Contribution of cystine‐glutamate antiporters to the psychotomimetic effects of phencyclidine. Neuropsychopharmacology. 2008;33:1760‐1772. [DOI] [PMC free article] [PubMed] [Google Scholar]
- 32. Lopez‐Gil X, Babot Z, Amargos‐Bosch M, Sunol C, Artigas F, Adell A. Clozapine and haloperidol differently suppress the MK‐801‐increased glutamatergic and serotonergic transmission in the medial prefrontal cortex of the rat. Neuropsychopharmacology. 2007;32:2087‐2097. [DOI] [PubMed] [Google Scholar]
- 33. Lorrain DS, Schaffhauser H, Campbell UC, et al. Group II mGlu receptor activation suppresses norepinephrine release in the ventral hippocampus and locomotor responses to acute ketamine challenge. Neuropsychopharmacology. 2003;28:1622‐1632. [DOI] [PubMed] [Google Scholar]
- 34. Yamamura S, Abe M, Nakagawa M, Ochi S, Ueno S, Okada M. Different actions for acute and chronic administration of mirtazapine on serotonergic transmission associated with raphe nuclei and their innervation cortical regions. Neuropharmacology. 2011;60:550‐560. [DOI] [PubMed] [Google Scholar]
- 35. Yamamura S, Ohoyama K, Hamaguchi T, et al. Effects of quetiapine on monoamine, GABA, and glutamate release in rat prefrontal cortex. Psychopharmacology. 2009;206:243‐258. [DOI] [PubMed] [Google Scholar]
- 36. Yamamura S, Ohoyama K, Hamaguchi T, et al. Effects of zotepine on extracellular levels of monoamine, GABA and glutamate in rat prefrontal cortex. Br J Pharmacol. 2009;157:656‐665. [DOI] [PMC free article] [PubMed] [Google Scholar]
- 37. Beierlein M. Synaptic mechanisms underlying cholinergic control of thalamic reticular nucleus neurons. J Physiol. 2014;592:4137‐4145. [DOI] [PMC free article] [PubMed] [Google Scholar]
- 38. Halassa MM, Acsady L. Thalamic inhibition: diverse sources, diverse scales. Trends Neurosci. 2016;39:680‐693. [DOI] [PMC free article] [PubMed] [Google Scholar]
- 39. Pratt JA, Morris BJ. The thalamic reticular nucleus: a functional hub for thalamocortical network dysfunction in schizophrenia and a target for drug discovery. J Psychopharmacol. 2015;29:127‐137. [DOI] [PubMed] [Google Scholar]
- 40. Jay TM, Thierry AM, Wiklund L, Glowinski J. Excitatory amino acid pathway from the hippocampus to the prefrontal cortex. Contribution of AMPA receptors in hippocampo‐prefrontal cortex transmission. Eur J Neurosci. 1992;4:1285‐1295. [DOI] [PubMed] [Google Scholar]
- 41. Kuroda M, Yokofujita J, Murakami K. An ultrastructural study of the neural circuit between the prefrontal cortex and the mediodorsal nucleus of the thalamus. Prog Neurobiol. 1998;54:417‐458. [DOI] [PubMed] [Google Scholar]
- 42. Leeson PD, Carling RW, James K, et al. Role of hydrogen bonding in ligand interaction with the N‐methyl‐d‐aspartate receptor ion channel. J Med Chem. 1990;33:1296‐1305. [DOI] [PubMed] [Google Scholar]
- 43. Hesselink MB, De Boer BG, Breimer DD, Danysz W. Brain penetration and in vivo recovery of NMDA receptor antagonists amantadine and memantine: a quantitative microdialysis study. Pharm Res. 1999;16:637‐642. [DOI] [PubMed] [Google Scholar]
- 44. Rammes G, Danysz W, Parsons CG. Pharmacodynamics of memantine: an update. Curr Neuropharmacol. 2008;6:55‐78. [DOI] [PMC free article] [PubMed] [Google Scholar]
- 45. Buisson B, Bertrand D. Open‐channel blockers at the human alpha4beta2 neuronal nicotinic acetylcholine receptor. Mol Pharmacol. 1998;53:555‐563. [DOI] [PubMed] [Google Scholar]
- 46. Kalivas PW. The glutamate homeostasis hypothesis of addiction. Nat Rev Neurosci. 2009;10:561‐572. [DOI] [PubMed] [Google Scholar]
- 47. Niswender CM, Conn PJ. Metabotropic glutamate receptors: physiology, pharmacology, and disease. Annu Rev Pharmacol Toxicol. 2010;50:295‐322. [DOI] [PMC free article] [PubMed] [Google Scholar]
- 48. Turner JP, Salt TE. Group III metabotropic glutamate receptors control corticothalamic synaptic transmission in the rat thalamus in vitro. J Physiol. 1999;519(Pt 2):481‐491. [DOI] [PMC free article] [PubMed] [Google Scholar]
- 49. Ohoyama K, Yamamura S, Hamaguchi T, et al. Effect of novel atypical antipsychotic, blonanserin, on extracellular neurotransmitter level in rat prefrontal cortex. Eur J Pharmacol. 2011;653:47‐57. [DOI] [PubMed] [Google Scholar]
- 50. Tanahashi S, Ueda Y, Nakajima A, Yamamura S, Nagase H, Okada M. Novel delta1‐receptor agonist KNT‐127 increases the release of dopamine and l‐glutamate in the striatum, nucleus accumbens and median pre‐frontal cortex. Neuropharmacology. 2012;62:2057‐2067. [DOI] [PubMed] [Google Scholar]
- 51. Pozzi L, Baviera M, Sacchetti G, et al. Attention deficit induced by blockade of N‐methyl d‐aspartate receptors in the prefrontal cortex is associated with enhanced glutamate release and cAMP response element binding protein phosphorylation: role of metabotropic glutamate receptors 2/3. Neuroscience. 2011;176:336‐348. [DOI] [PubMed] [Google Scholar]
- 52. Traynelis SF, Wollmuth LP, McBain CJ, et al. Glutamate receptor ion channels: structure, regulation, and function. Pharmacol Rev. 2010;62:405‐496. [DOI] [PMC free article] [PubMed] [Google Scholar]
- 53. Narita M, Yoshizawa K, Nomura M, Aoki K, Suzuki T. Role of the NMDA receptor subunit in the expression of the discriminative stimulus effect induced by ketamine. Eur J Pharmacol. 2001;423:41‐46. [DOI] [PubMed] [Google Scholar]
- 54. Cross L, Brown MW, Aggleton JP, Warburton EC. The medial dorsal thalamic nucleus and the medial prefrontal cortex of the rat function together to support associative recognition and recency but not item recognition. Learn Mem. 2012;20:41‐50. [DOI] [PMC free article] [PubMed] [Google Scholar]
- 55. Ostlund SB, Balleine BW. Differential involvement of the basolateral amygdala and mediodorsal thalamus in instrumental action selection. J Neurosci. 2008;28:4398‐4405. [DOI] [PMC free article] [PubMed] [Google Scholar]
- 56. Chan A, Paskavitz J, Remington R, Rasmussen S, Shea TB. Efficacy of a vitamin/nutriceutical formulation for early‐stage Alzheimer's disease: a 1‐year, open‐label pilot study with an 16‐month caregiver extension. Am J Alzheimers Dis Other Demen. 2008;23:571‐585. [DOI] [PMC free article] [PubMed] [Google Scholar]
- 57. Rapado‐Castro M, Dodd S, Bush AI, et al. Cognitive effects of adjunctive N‐acetyl cysteine in psychosis. Psychol Med. 2017;47:866‐876. [DOI] [PubMed] [Google Scholar]